IPOs Demystified: A Practical Investing Guide
An initial public offering is the first time a company offers its shares to the general public. For the company it is a capital raise and the start of a life of public reporting; for investors it is a chance to own a business that had no public market a day earlier, at a price set by negotiation rather than by trading. This guide follows the SEC's own investor guidance on IPOs: how an offering is registered and priced, what the prospectus contains, why the first weeks of trading behave differently from an established stock, and how Quant Charts can help once the shares are listed.
How an IPO Works
Under the federal securities laws a company may not offer or sell shares to the public unless the transaction is registered with the SEC or an exemption applies. To register an IPO the company files a registration statement, typically on Form S-1, whose central part is the prospectus: the offering document that describes the company, the terms of the offering, its business, financial condition and management.
SEC staff review the registration statement for compliance with disclosure requirements and accounting standards, and their comments usually lead to revisions. The SEC's bulletin is explicit about what that review is not: it is not a guarantee that the disclosure is complete or accurate, the staff do not evaluate the merits of any IPO, and the order declaring the registration statement effective is not an approval. Responsibility for the disclosure rests with the company and the people who prepared the filing.
| Stage | What happens | Where to see it |
|---|---|---|
| Registration | The company files Form S-1 with a preliminary prospectus; amendments are filed as S-1/A | SEC EDGAR |
| Review | SEC staff comment on disclosure; the company revises | Comment letters appear on EDGAR at least 20 business days after effectiveness |
| Pricing | Underwriters gather indications of interest and recommend a price; the issuer decides | Underwriting or Plan of Distribution section of the prospectus |
| Effectiveness and sale | The SEC declares the statement effective; shares are sold at the offering price | Final prospectus filed as 424B3 or 424B4 |
| Listing and trading | Shares begin trading on the exchange named in the prospectus | Exchange quote; Quant Charts Symbol Search |
| Public company life | Quarterly and annual reports on Forms 10-Q and 10-K | EDGAR |
The underwriters are the investment banks that manage and sell the offering. Before effectiveness they collect indications of interest from prospective buyers and use that order book to recommend a price; the company makes the final decision. In conjunction with the IPO the company usually applies to list on an established exchange such as the New York Stock Exchange or Nasdaq, and once public it must keep reporting.
Two Ways to Buy an IPO
The SEC describes two routes. If you are a client of an underwriter involved in the deal, you may be offered shares directly at the offering price. In practice underwriters distribute most of the allocation to institutional and high-net-worth clients such as mutual funds, hedge funds, pension funds and insurance companies, so a direct allocation in a popular IPO is unusual for an individual investor. The more common route is to buy in the public market in the days after listing, through an ordinary brokerage order at whatever price the market sets.
The distinction matters because the two prices can differ a great deal. The offering price is a negotiated estimate of value; the SEC notes that it is not uncommon for the closing price shortly after the IPO to be well above or well below it.
Reading the Prospectus
A new public company has no reporting history, so the prospectus is usually the only substantial source of information. The SEC highlights the sections below and recommends checking that you are reading the most recent filing, since the document is revised through the review process.
| Section | What it tells you |
|---|---|
| Prospectus summary | The business, strategy, planned use of the money raised, financial condition and offering terms in brief |
| Risk factors | Risks management believes could significantly affect the business or the investment |
| Use of proceeds | What the company will do with the money it raises |
| Dividend policy | History of and plans for paying dividends |
| Dilution | The gap between the IPO price and both the book value per share and the average price paid by founders, officers and early investors |
| Management's discussion and analysis | Management's narrative on financial condition, results and the factors expected to affect them |
| Business and legal proceedings | Products, markets, key suppliers and customers, competition, and significant litigation |
| Management | Biographies of directors and executive officers |
| Financial statements and notes | Audited statements with the independent auditor's opinion |
| Principal and selling shareholders | Who is selling into the offering, how much they keep, and their relationship with the company |
Two disclosure rules shape what you will find. Emerging growth companies and smaller reporting companies need only include two years of audited financial statements rather than three. And if existing holders are selling, the cover page shows how many shares come from them; those proceeds go to the sellers, not to the company. The SEC also suggests verifying prospectus claims against independent sources wherever possible.
How the Offering Price Is Set
The SEC's bulletin describes pricing as a mix of market conditions, analysis and negotiation among parties with competing interests. The company wants a high price to raise more capital. The underwriters share that interest because their compensation is typically a percentage of the offering price, but they also have to sell the deal, so they want a price their clients find attractive. Underpricing creates a discount for initial investors, increases demand and helps place all the shares; it may also produce a first-day "bump" that pleases allocation holders and disappoints a company that could have raised more.
Behind the negotiation sit valuation analyses of revenues, customers and financial results, and the order book of indications of interest. Whichever way it is resolved, the bulletin's conclusion is the one to keep: the offering price reflects an estimate, and the market price may bear little relationship to it.
Why the First Weeks Trade Differently
- Limited supply. On the first day the only shares that can trade are generally those sold in the IPO. Shares held by founders, early investors and employees are usually restricted securities or covered by lock-up agreements, in which insiders agree not to sell for a set period, typically 180 days. Underwriter policies that discourage flipping, the immediate resale of allocated shares, further limit early supply.
- Stabilization. Underwriters may support the price in the first few days with trading activity, including buying shares, to keep it from falling too far below the offering price. Once that support ends, the price may fall well below the offering level.
- Lock-up expiry. When the lock-up period ends, insiders can sell for the first time. The prospectus states the lock-up terms, so the expiry date is knowable in advance.
- Quiet period. From the filing of the registration statement until it is declared effective, the company must ensure that its communications comply with the securities laws; the SEC calls violations "gun-jumping." Expect little from the company itself during this window.
- No history. There are no prior quarterly reports to compare against, and no price history beyond the first prints, so most of the usual analytical anchors are missing.
Where Quant Charts Fits
LuxAlgo does not allocate IPO shares, read filings for you or place orders. The prospectus work above is done on EDGAR. What Quant Charts adds begins the moment the shares list: the price and volume record of a stock with no history, and tools built for exactly that situation.
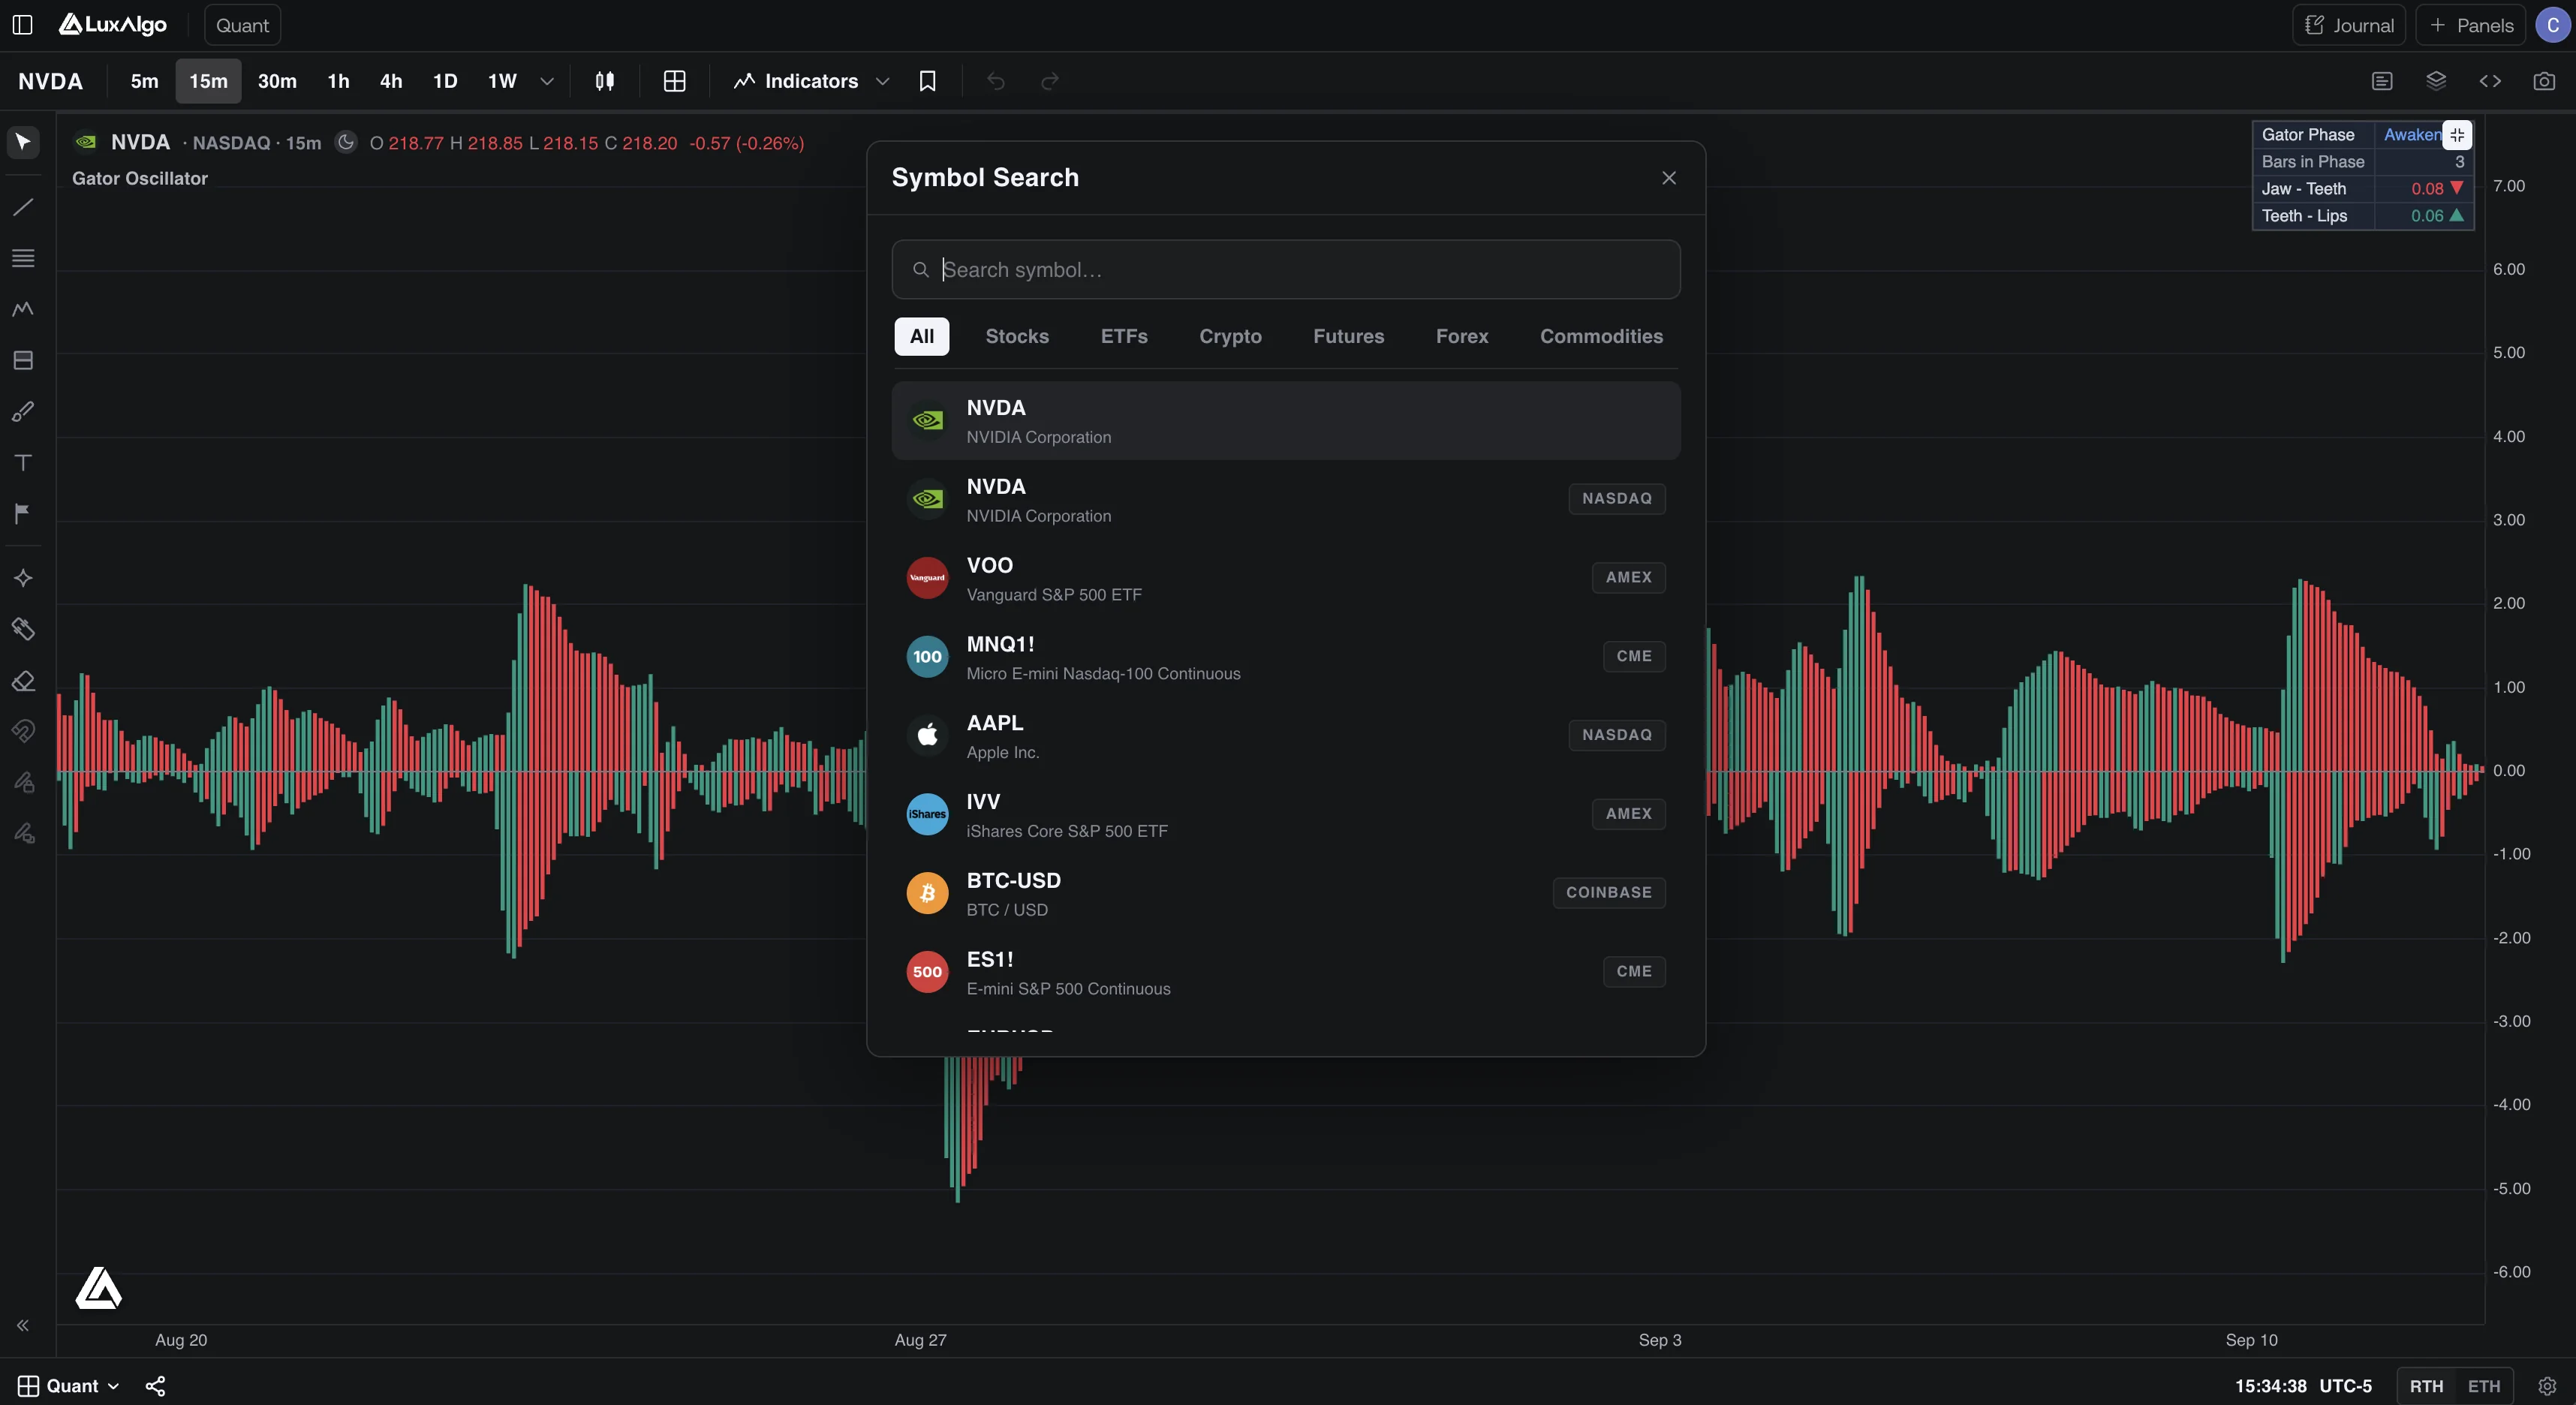
Find the new ticker. Quant Charts sources US equities, including ETFs, from Cboe EDGX on every plan. Open Symbol Search and look up the new listing by ticker or name; the chart starts at the first print, so every bar on it is post-IPO data.
Anchor to the first trade. With no prior history, the opening print is the natural reference. An anchored VWAP started on the first bar tracks the average price paid by everyone who has bought since listing. Price above a rising line means the average post-IPO buyer is in profit; price below a falling one means the average holder is underwater, which is the condition that makes a lock-up expiry more consequential.
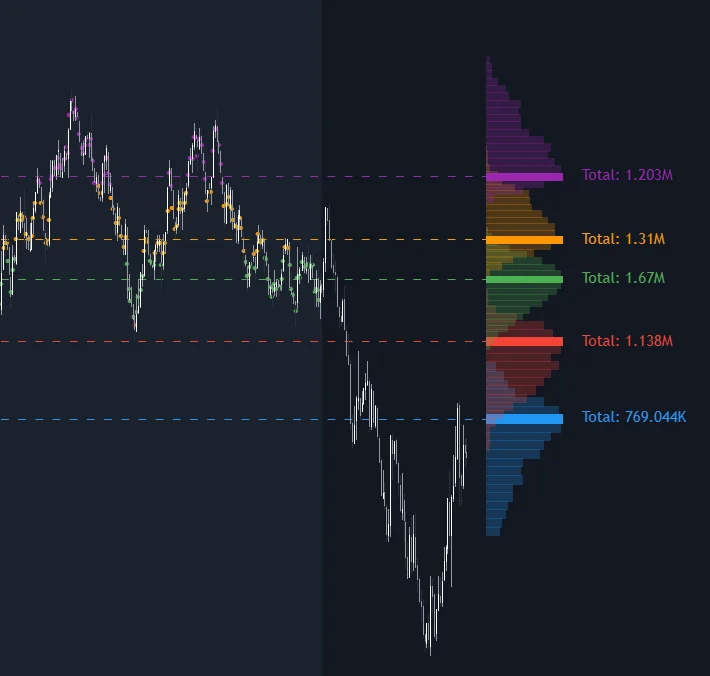
Map where the volume traded. A volume profile over the post-listing range shows the prices at which most shares changed hands, with high- and low-volume nodes marking accepted and rejected prices. The Anchored Clusters Volume Profile indicator takes a window you place on the chart, from the first bar to today for a new listing, and draws a separate profile for each price regime it finds, each with its own point of control. For a stock that has traded for weeks rather than years, it shows whether the early range and the current range are the same auction or two different ones.
Judge breakouts by participation. New listings break out of their opening ranges often, and many of those moves fail. The Library's breakout and false breakout entries explain what distinguishes the two, and relative volume measures whether a move drew participation above the stock's own short baseline. Because that baseline is only days old for a recent IPO, treat the reading as context rather than a signal.
Test rules across many IPOs, not one. Describe a rule to Quant, our coding agent, in plain language, for example a long entry when price closes above the high of the first five sessions and a stop under the low of that range. Quant writes the Pine Script; open Code to inspect it, then click Run. The Backtest Summary reports net profit, trade count, win rate, max drawdown and profit factor, with commission and slippage set in the strategy's Properties. A single new listing gives one trade at most, so use the backtest viewer to re-run the same rule on several past IPOs before trusting any figure, and log live trades in the Journal with the listing and lock-up expiry dates noted.
The video below shows how indicators such as the Anchored Clusters Volume Profile are added to a chart in Quant Charts.
Where Each Tool Stops
- SEC EDGAR holds the S-1 and its amendments, the final prospectus, staff comment letters and the later 10-Q and 10-K reports. It is the only source for use of proceeds, dilution, lock-up terms and selling shareholders.
- The underwriters and your broker control allocations at the offering price and execute orders in the market afterwards.
- Quant Charts charts the listed shares from the first print, anchors volume-weighted levels and volume profiles to the listing, measures relative volume and backtests rules through Quant. It does not access allocations, read filings or place orders.
- The Library explains breakouts, false breakouts, anchored VWAP, volume profiles and volume nodes, and provides the indicators that implement them.
Conclusion
An IPO is a registered offering whose price is negotiated before the market has a say, sold mostly to institutions, and followed by a period in which supply is artificially thin, underwriters may be supporting the price, and insiders are waiting for a lock-up to expire. The SEC's review confirms that required disclosures are present, not that the investment is sound, so the prospectus on EDGAR is where the work is done. Once the shares trade, Quant Charts provides the tools that fit a stock with no history: an average price anchored to the first trade, volume profiles of the early auction, participation-checked breakouts and rules tested across many listings rather than one.
Key Takeaways
- An IPO is registered with the SEC on Form S-1; the prospectus is the offering document, and SEC effectiveness is not an approval of merits.
- Underwriters recommend the price from an order book of indications of interest; the issuer decides; the offering price may bear little relationship to the trading price.
- Most allocations go to institutional and high-net-worth clients; individuals usually buy in the market after listing.
- Read the risk factors, use of proceeds, dilution, MD&A, financial statements and selling-shareholder sections; check for the most recent filing and the 424B final prospectus.
- Early trading is shaped by limited supply, lock-up agreements of typically 180 days, anti-flipping policies and underwriter stabilization.
- Quant Charts charts the listing from its first print and offers anchored VWAP, clustered volume profiles, relative volume and Quant backtests; it does not allocate shares or read filings.
FAQs
What is an IPO?
An initial public offering is the first time a company offers its shares to the general public. The offering must be registered with the SEC, typically on Form S-1, and the prospectus inside that filing describes the company and the terms of the sale.
Does the SEC approve IPOs?
No. SEC staff review the registration statement for required disclosures and may require revisions, but the SEC's bulletin states that declaring a registration statement effective is not an approval of the offering's merits or a guarantee that the disclosure is complete or accurate.
How can an individual investor buy IPO shares?
Either through an allocation from an underwriter at the offering price, which usually goes mainly to institutional and high-net-worth clients, or by buying in the public market after the shares list. Most individual investors use the second route.
What is a lock-up agreement?
An agreement in which company insiders and large shareholders agree not to sell their shares for a set period after the IPO, typically 180 days. Its terms are disclosed in the prospectus, and its expiry can add supply to a market that has been trading only the IPO shares.
Why does the stock trade far from the offering price?
The offering price is a negotiated estimate set before public trading, influenced by the company's desire for capital, the underwriters' compensation and their need to place the shares, and by underpricing that creates a first-day discount. The SEC notes that the trading price shortly after the IPO is often well above or below it.
How can Quant Charts help with a new listing?
It charts the stock from its first trade, so you can anchor a VWAP to the opening print, draw clustered volume profiles over the post-listing range, check breakouts against relative volume and backtest rules across several past IPOs through Quant. It does not provide allocations, read filings or place orders.
References
LuxAlgo Resources
- Anchored VWAP, Volume Profile and High/Low-Volume Nodes (LuxAlgo Library)
- Breakout, False Breakout and Relative Volume (LuxAlgo Library)
- Anchored Clusters Volume Profile indicator (LuxAlgo Library)
- Quant Charts market data and Charts introduction (LuxAlgo Docs)
- Making strategies with Quant, Reading a strategy backtest and Journal (LuxAlgo Docs)
External Resources
Read next