Quant 2.0: Backtest Loop Runs for Hours While You're Away
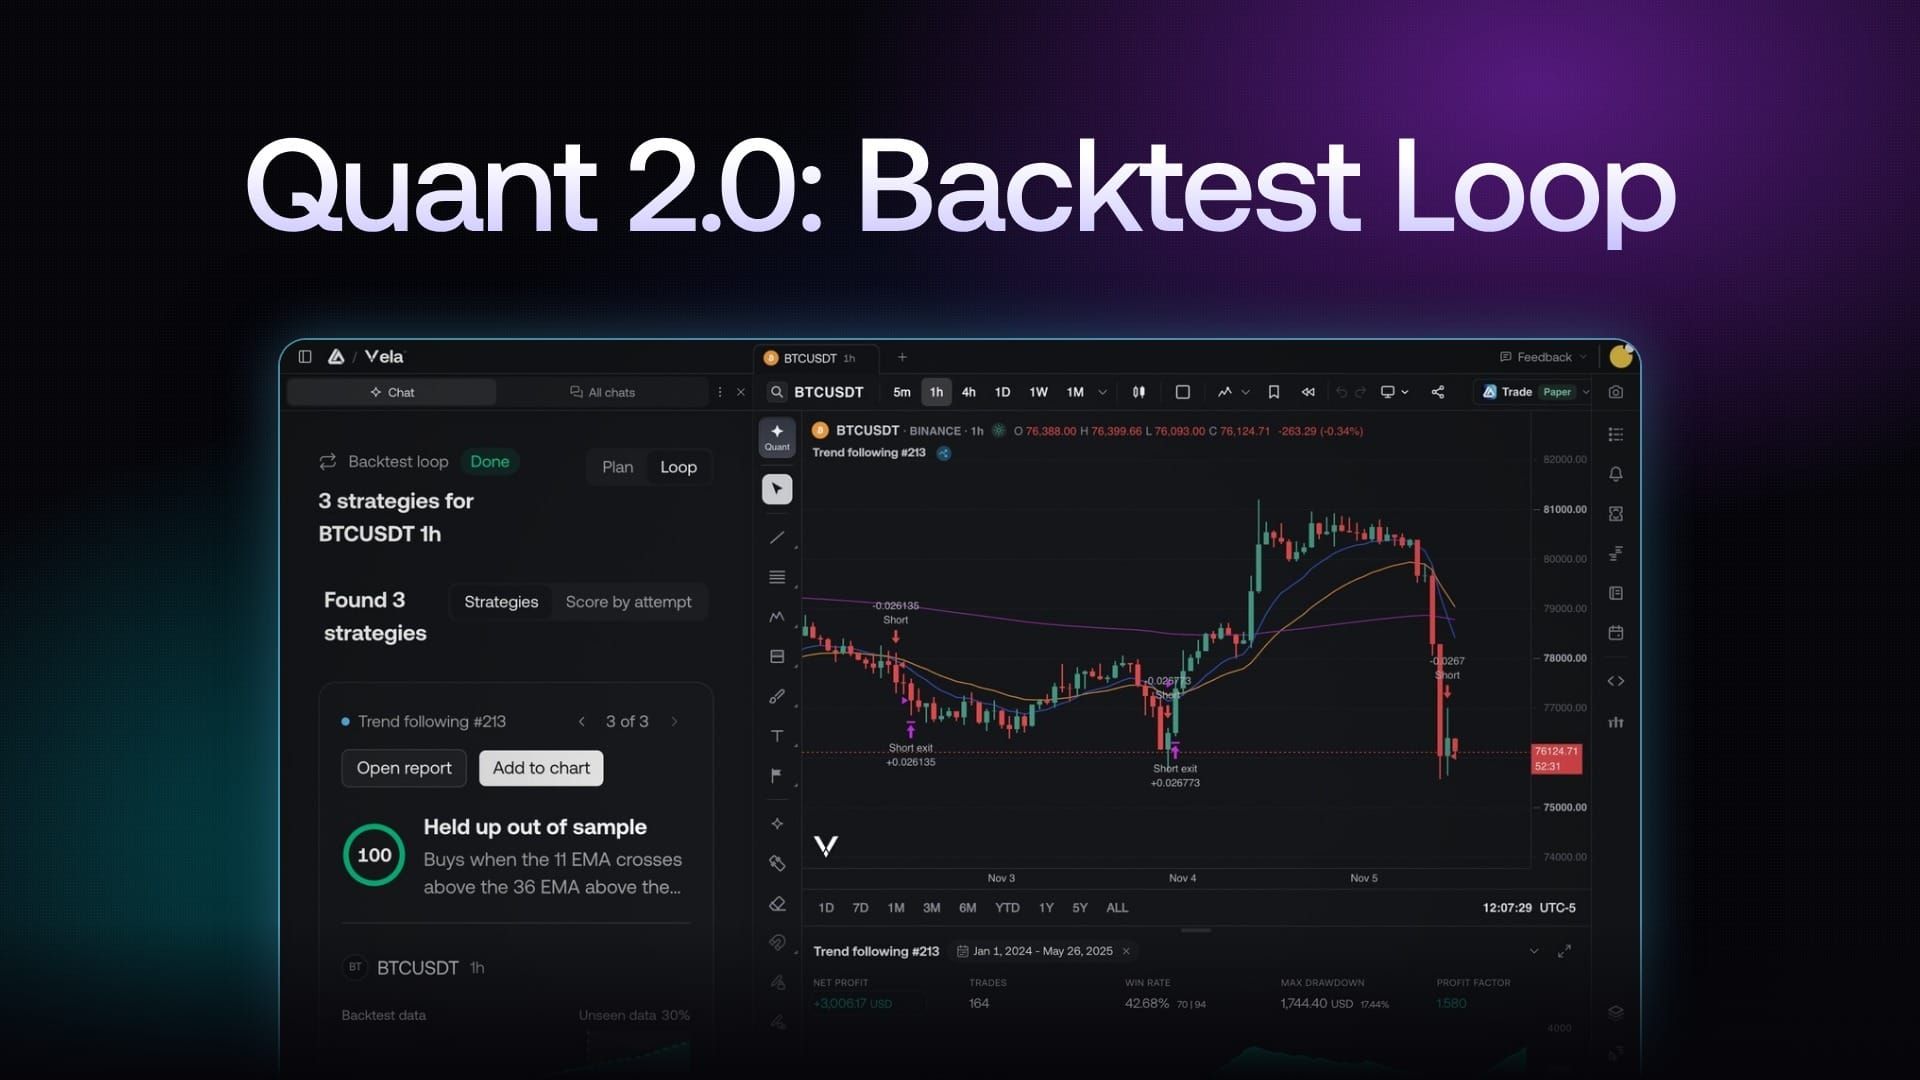
Today we're launching Quant 2.0, starting with Backtest Loop. It runs for hours in the background or while you're away, tests hundreds of strategies, and keeps the ones that hold up on data they've never seen.
Inside Vela, our next-generation charting platform, you tell Quant, our coding agent, what a strategy has to achieve, such as a minimum win rate, a maximum drawdown or a minimum profit factor. Backtest Loop writes a Pine Script® strategy, backtests it, reads the results and rewrites it. It repeats that cycle on its own until a strategy meets your targets or the loop runs out of budget.
Until now, building a strategy to a specification meant doing the loop yourself: generate code, run the backtest, read the numbers, adjust, run it again. Most of that work is mechanical, and most of the time goes into waiting and re-reading. We built the loop so that part runs without you. You set the bar, approve the plan, and come back to a report of every attempt and the strategies that cleared it.
The loop starts from the Quant chat on any chart at https://vela.luxalgo.com/chart. When it finishes, you get an email, and the results sit in a Loop Report you can open, inspect and add to your chart.
Describe the Target, Approve the Plan
A loop begins as a normal message to Quant. Describe the strategy you want and the numbers it has to hit. For example: "Find a BTC and ETH 4h strategy with profit factor above 1.5, max drawdown under 15% and at least 100 trades." Quant reads that request and proposes a loop plan: the markets it will test on, the time windows it will use and the pass criteria a strategy must meet.
Nothing runs until you accept the plan. You can review it in the Plan view, adjust the markets, the windows or the thresholds in chat, and approve it once it matches what you meant. The plan is the contract: once accepted, a separate agent takes it and starts working through attempts in the background, so your chat stays free and you can close the tab while the loop runs.
Pass criteria draw on about 60 built-in metrics, covering the things traders actually screen for:
- Returns and profit factor
- Drawdown
- Win rate
- Trade counts
- Daily equity statistics
Each criterion takes a minimum, a maximum or both, and a few take a parameter. That is enough to express "at least 100 trades", "drawdown no worse than 15%" and "profit factor above 1.5" in a single plan, and to apply the same bar across several markets at once.
Every Attempt Is a Real Backtest
This is not one-shot code generation. Every attempt is really backtested, and the agent decides what to change next from the results of the attempt before it, not from a guess about what might work.
To keep a passing strategy from being a curve fit, part of the data is held out. The agent sees full numbers on the portion it tunes on, but only pass or fail on the held-out portion. It cannot see why a strategy failed on unseen data, so it cannot quietly tune toward it. A strategy that passes has had to hold up on data the agent never optimised against.
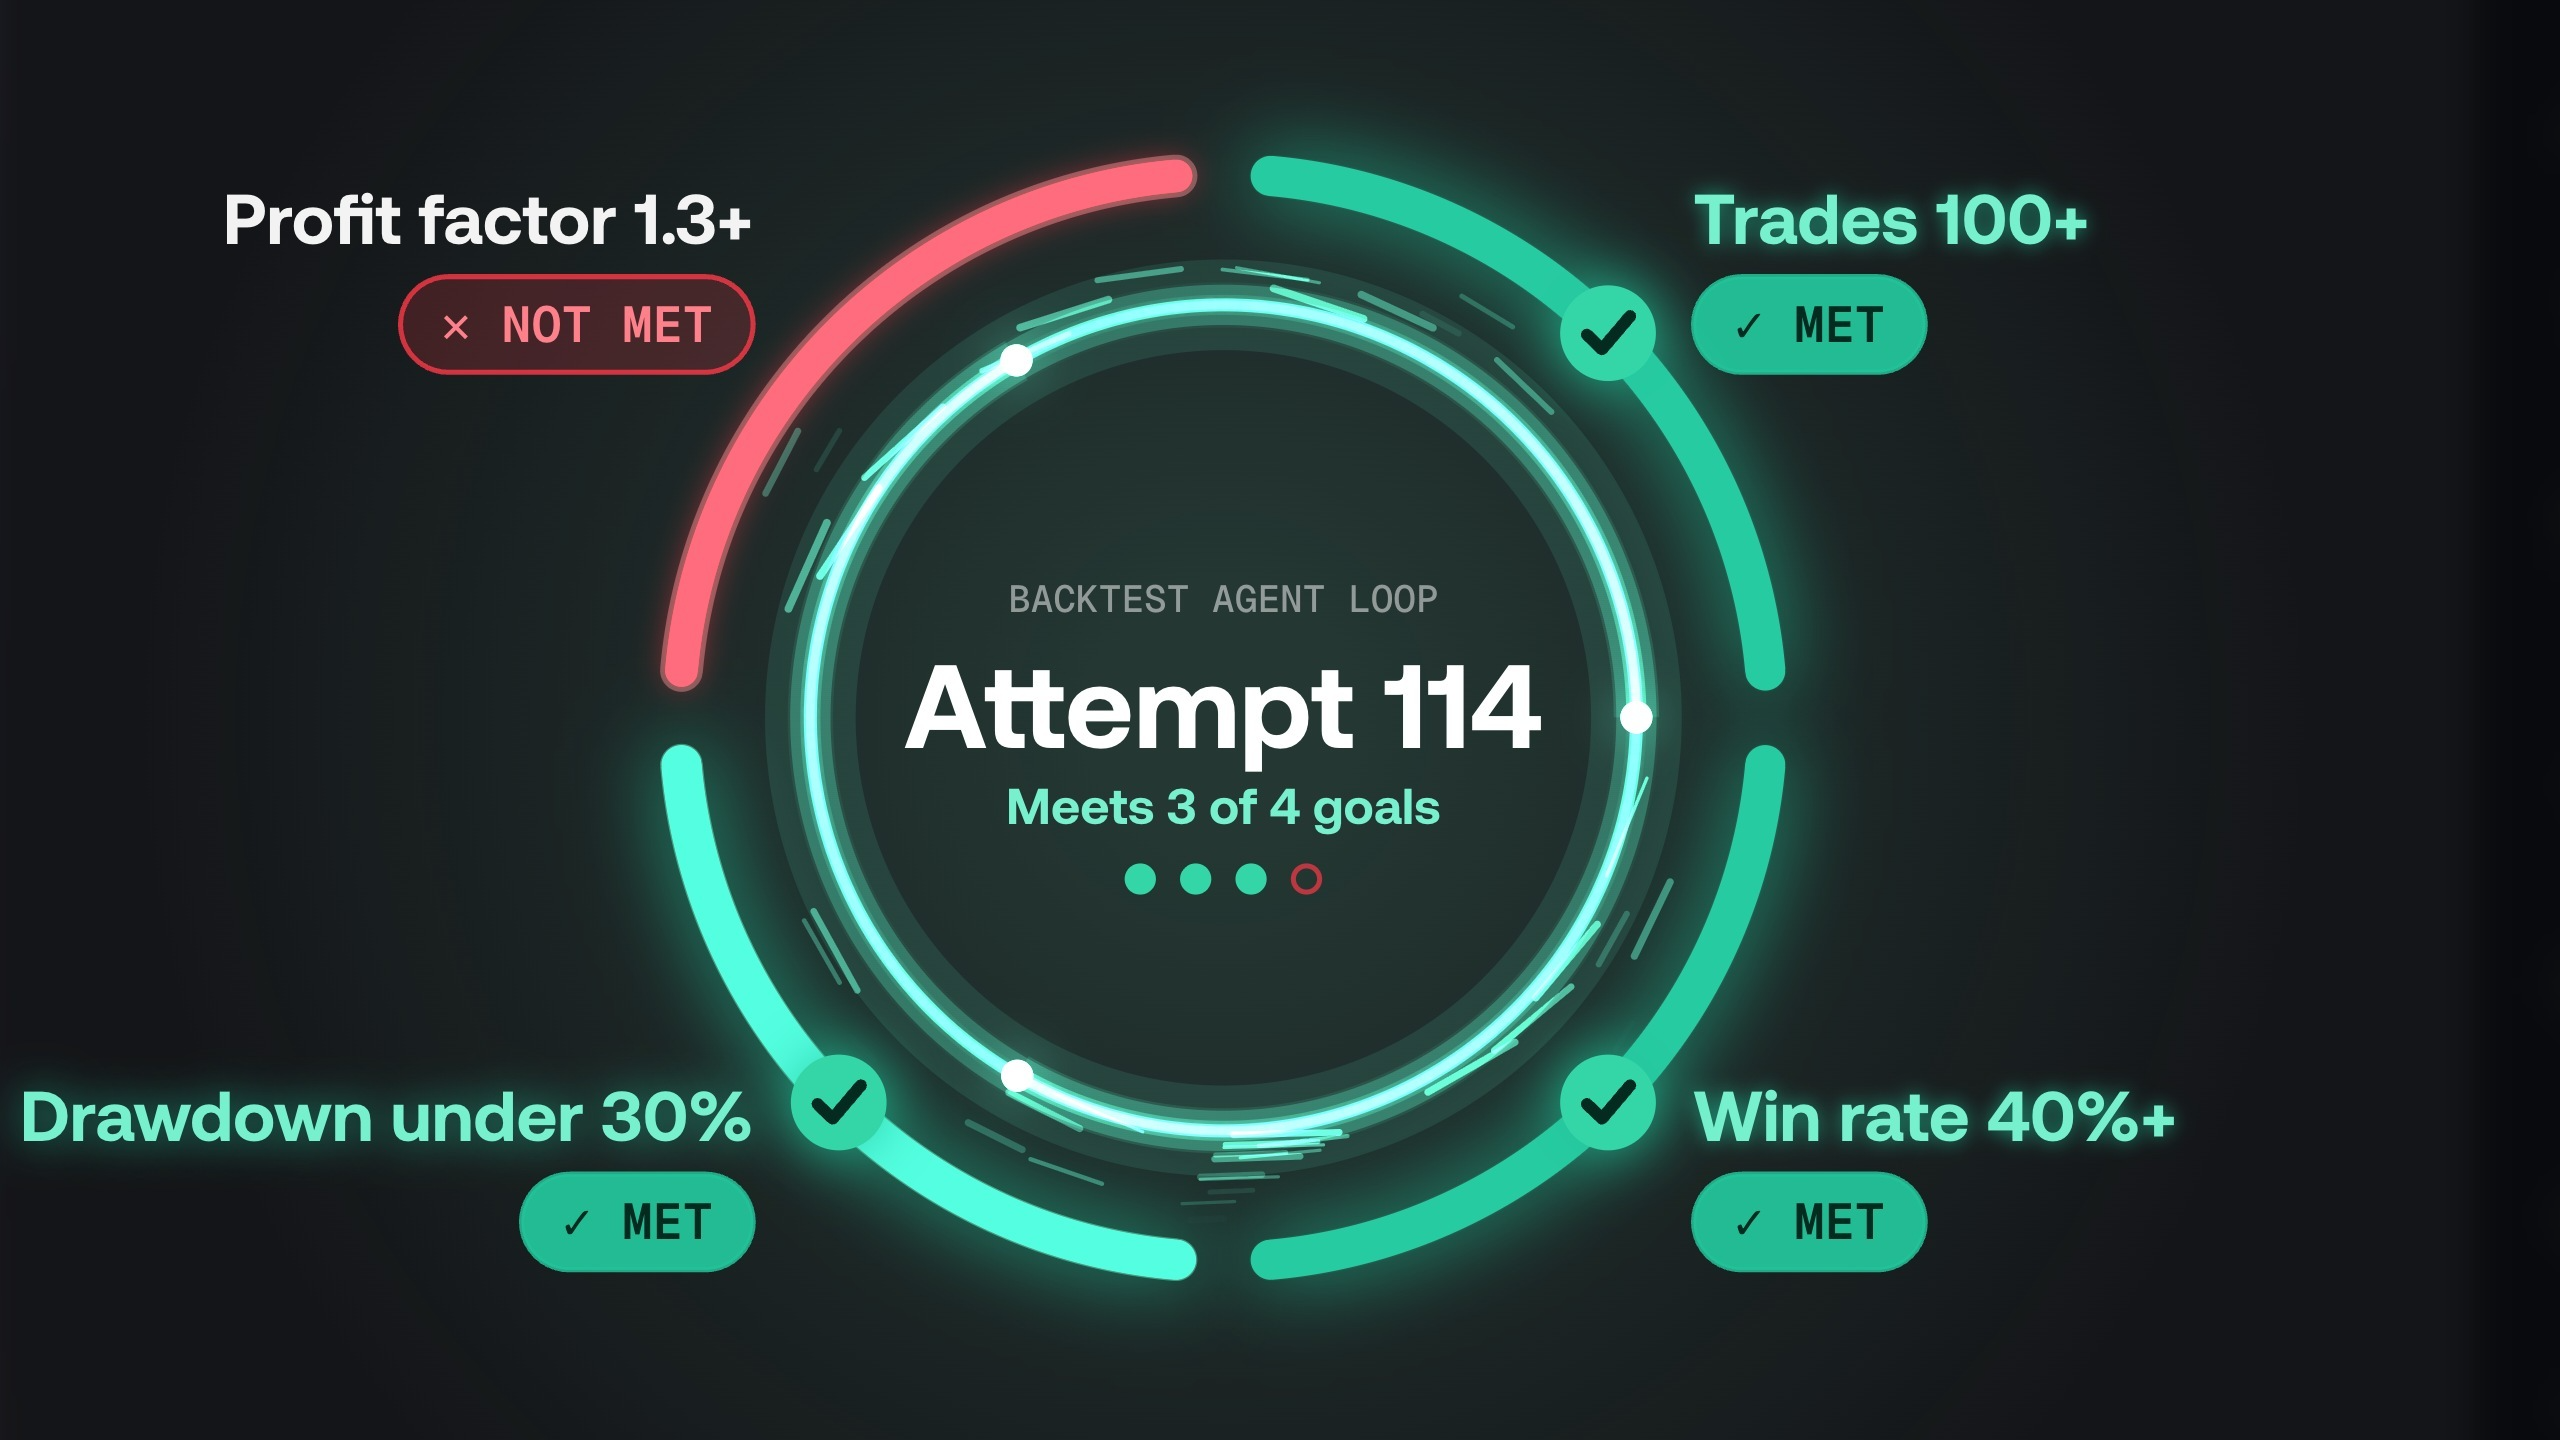
Near misses earn partial credit. A strategy that lands at a profit factor of 1.45 against a target of 1.5 scores closer than one at 0.9, so each rewrite moves toward the target instead of starting over at random. The loop keeps going until a strategy passes every criterion or the budget for the loop is spent, which can mean hundreds of attempts.
The Loop Report Shows Every Attempt
When a loop finishes, open the Loop Report tab. It lists every attempt with its score per market, its metrics and its simulation. The Strategies view shows the ones that passed; Score by attempt shows how the loop progressed from the first draft to the last. Each passing strategy comes with a plain-language summary of its logic and a chart that splits the backtest data from the unseen data, so you can see how it performed on the part it was never tuned on.
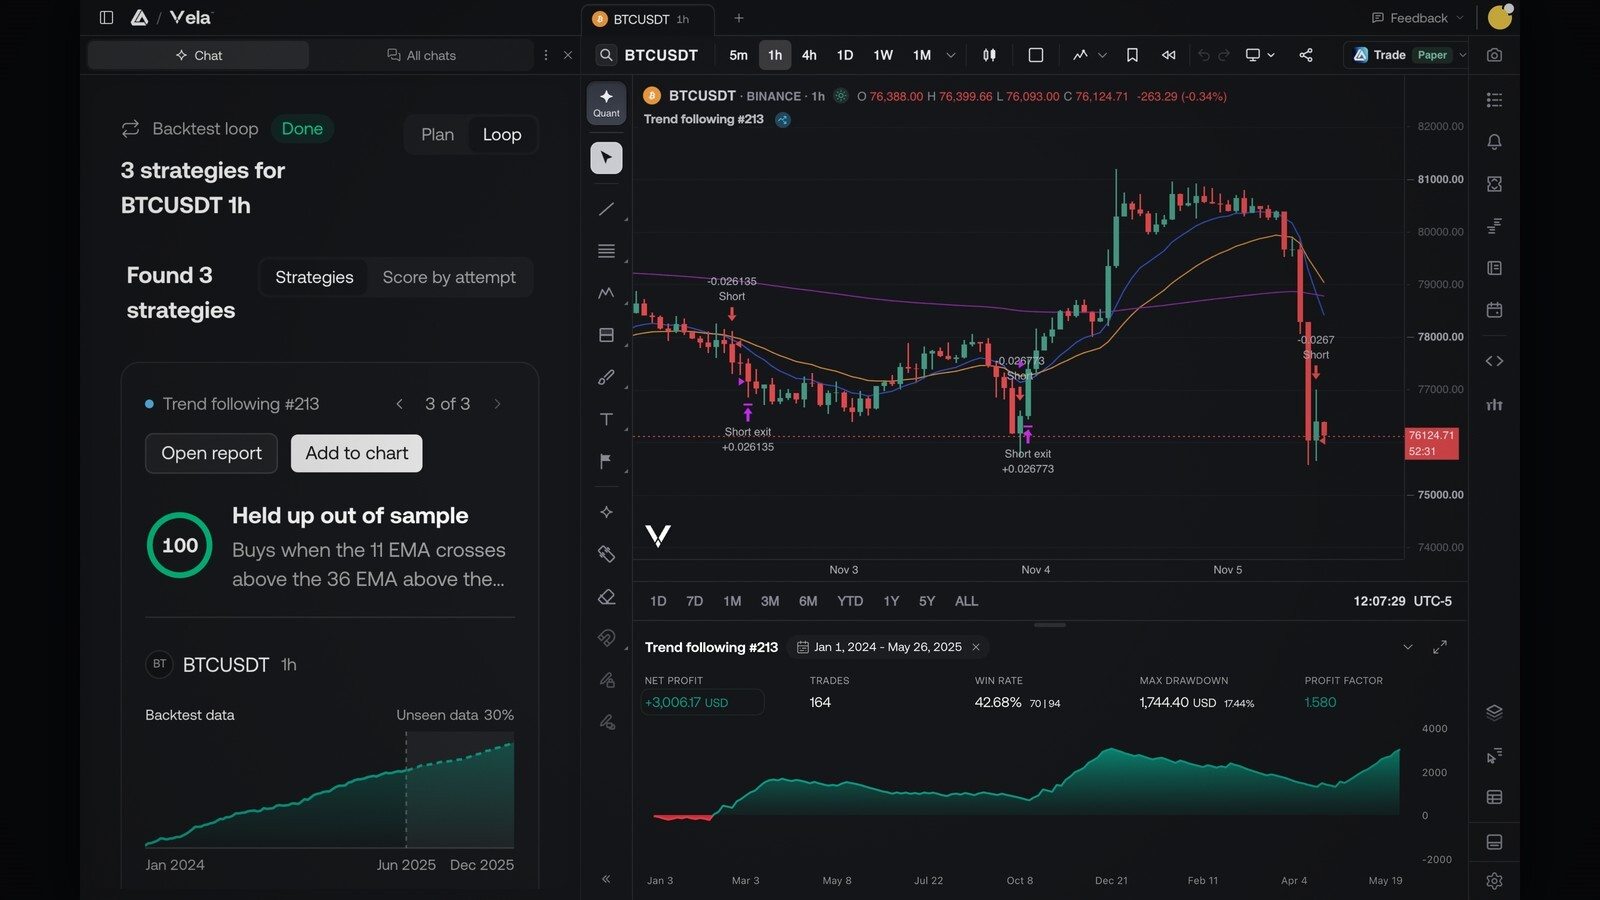
The run above asked for BTCUSDT on the 1h chart and found three strategies. One of them, Trend following #213, buys when the 11 EMA crosses above the 36 EMA, scored 100 and held up out of sample, with 30% of the data held back as unseen. Its backtest from Jan 1, 2024 to May 26, 2025 shows 164 trades, a 42.68% win rate, a 17.44% max drawdown and a profit factor of 1.580. Those numbers are from that backtest run and nothing else.
From any attempt, two buttons do the rest. Open report loads its full backtest. Add to chart puts the strategy on your chart, where you can read the code, see its trades plotted on price and keep working on it with Quant. A failed attempt is still useful: its metrics show you which constraint was the hard one.
Prop Firm Challenge Mode
Some traders do not need a profit factor; they need to pass a challenge. Prop firm challenge mode judges a strategy against challenge rules instead of plain criteria, so the loop optimises for what the evaluation actually checks.
The backtest report carries this through in its Prop Firms tab. It checks a strategy's trades against challenge rules and sorts them into passes, near misses and no fits. In the run below, 164 trades on BTCUSD passed 160 of 191 crypto challenges across 12 firms, with 31 near misses. Each challenge card shows how many days the backtest took to pass, the closest call as the room left before a limit, and how many start dates passed.
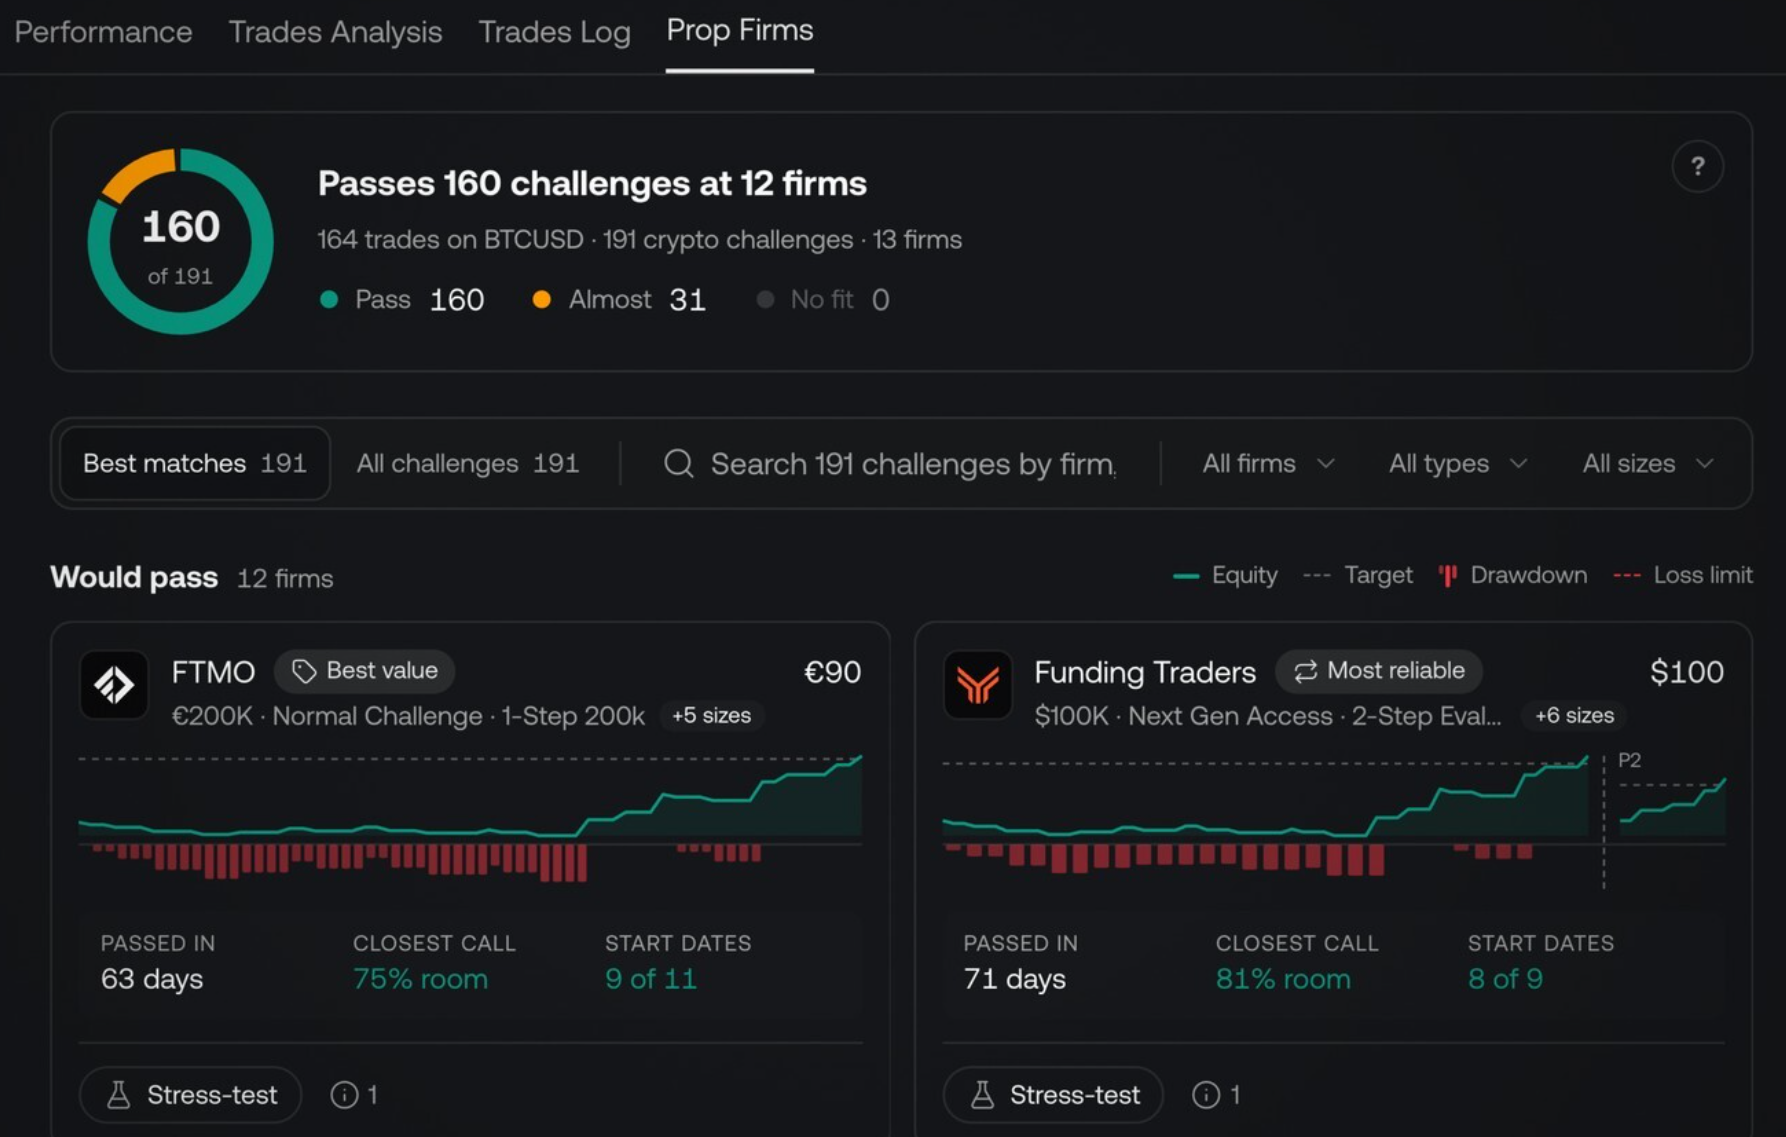
A single backtest is one ordering of trades. The Stress-test button on each card reshuffles the strategy's trades into 2,000 simulated histories and reports how many of them pass the same challenge. In one run, 78% of simulated attempts passed a 1-step 200K challenge, with a 95% range of 77% to 80%. A position size row shows the pass rate at multiples of the backtest's size, from 0.25x to 2x, so you can see where sizing up starts to cost you passes.
Under the Hood, and the Limits
Backtests in the loop run on our servers, inside an isolated sandbox with no network access. Strategy code runs through PineTS, our open-source Pine Script® runtime, the same runtime that runs Pine Script® code across LuxAlgo. Daily equity statistics are rebuilt from closed trades.
That design sets the current limits, and we would rather state them plainly:
- Metrics come from trades and backtest summaries, not bar-by-bar equity. Daily equity figures reflect closed trades, so open-trade swings are not part of the calculation.
- Custom metrics are not supported yet. Criteria come from the built-in set of about 60.
- A loop stops when its budget runs out. Not every plan finds a passing strategy, and a loop that ends without one still leaves every attempt in the report.
Backtesting is research, not prophecy. The held-out data, the partial credit and the stress test exist to make a passing strategy more trustworthy, not to make it a promise.
Try It
Backtest Loop is on Ultimate and Ultra. Open a chart at https://vela.luxalgo.com/chart, open the Quant chat and describe the strategy you want with the numbers it has to hit. Review the loop plan, accept it, and go do something else. You will get an email when the loop finishes, and every attempt will be waiting in the Loop Report.
Read next