Quant Now Draws on Your Vela Charts
For many traders, the day starts with markup: the previous day's high and low, the New York midnight open, the gaps left overnight, the liquidity resting above equal highs. It is careful, repetitive work, done by hand on every symbol you watch, every morning.
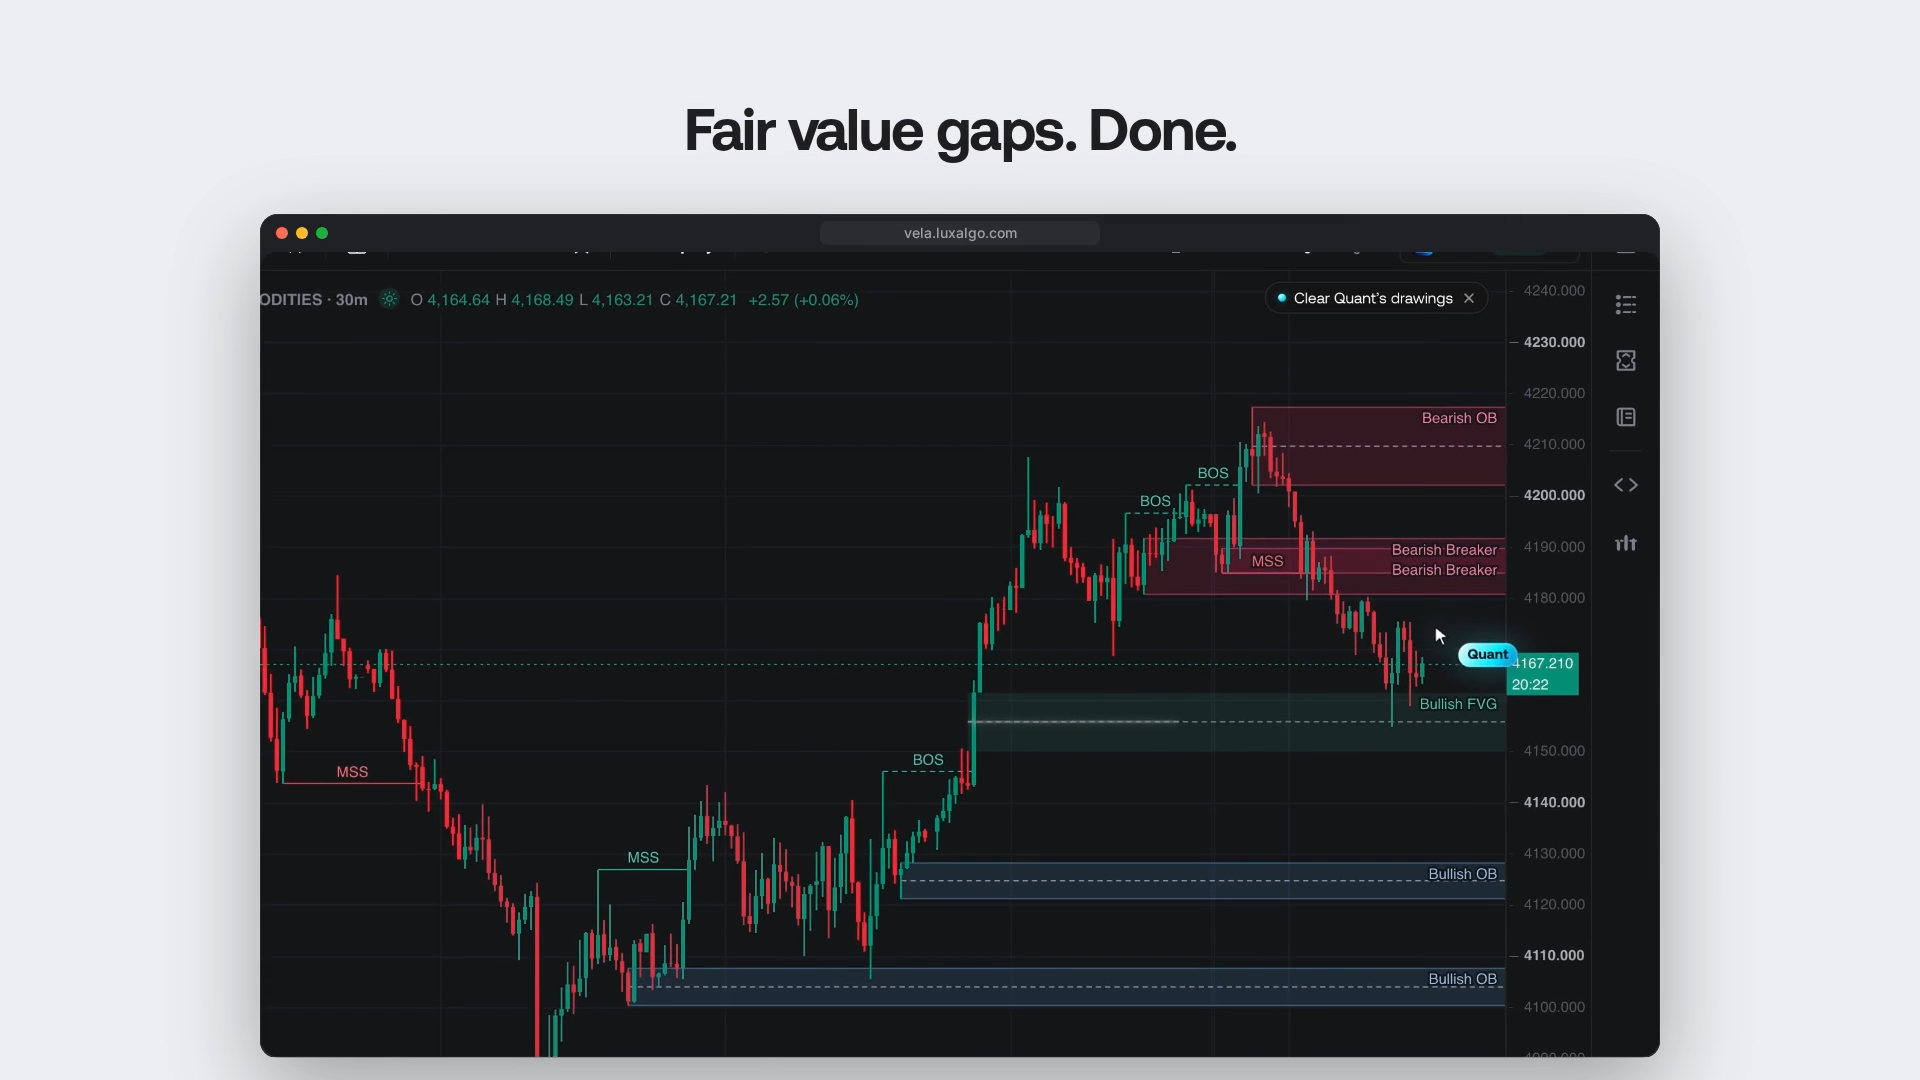
We built a way to hand that work over. Quant, our coding agent, can now draw directly on Vela, our next-generation charting platform. You ask in plain words, such as "mark the FVGs and liquidity", "draw the dealing range" or "show me the NY killzones", and the markup appears on your chart as normal drawings. They are the same kind you place yourself: you can move, recolor, hide or delete them. Before it draws, Quant writes one short sentence saying what it is about to do. Then a small Quant cursor glides to each spot and each drawing glows in, so you watch the chart being marked up instead of receiving a finished picture.
Quant can also now read exact bars, plot values and strategy trades straight from the chart, and change a script's settings without rewriting its code. All of it runs on your chart at https://vela.luxalgo.com/chart.
Every level sits on your chart’s own candles
Quant places each drawing on the candles that formed it. Ask for a dealing range and the high and the low land on the bars that made them. Each label shows its level, for example “Range High (21,435.00)”, so you can check any drawing against your chart.
Quant draws only from closed candles, so a level doesn’t shift while the current candle is still forming.
Ask “mark the fair value gaps and buyside/sellside liquidity on NQ 1m” and the gaps and liquidity pools that appear are the ones on your chart, placed where you would place them yourself.
What Quant Can Mark Up
One request can combine several concepts, so a single sentence can produce a full morning markup. Quant covers three families of drawings.
ICT and SMC concepts:
- Fair value gaps, with consequent encroachment (CE) and inversions
- Buyside and sellside liquidity, including equal highs and lows
- Market structure: break of structure (BOS) and market structure shift (MSS)
- Order blocks and breakers
- The dealing range, split at equilibrium into premium and discount, with the OTE zone
- NWOG and NDOG opening gaps
- Killzones (Asia, London, NY AM, NY Lunch, NY PM) and ICT macros
- Key levels: previous day and week high and low, the New York midnight open, and Asia, London and New York session highs and lows
Classic technical analysis:
- Support and resistance zones built from clustered reactions
- Trendlines
- Channels, wedges and triangles, validated against the closes and ended at the breakout
- A trader's range marked 1 / 0.5 / 0, with extensions
Freeform scenarios. Quant can also draw its own read of the chart using levels, zones, trendlines, a projected path with an arrow to a target, channels, Fibonacci retracements, text notes such as a numbered setup, vertical time lines, and long and short positions.
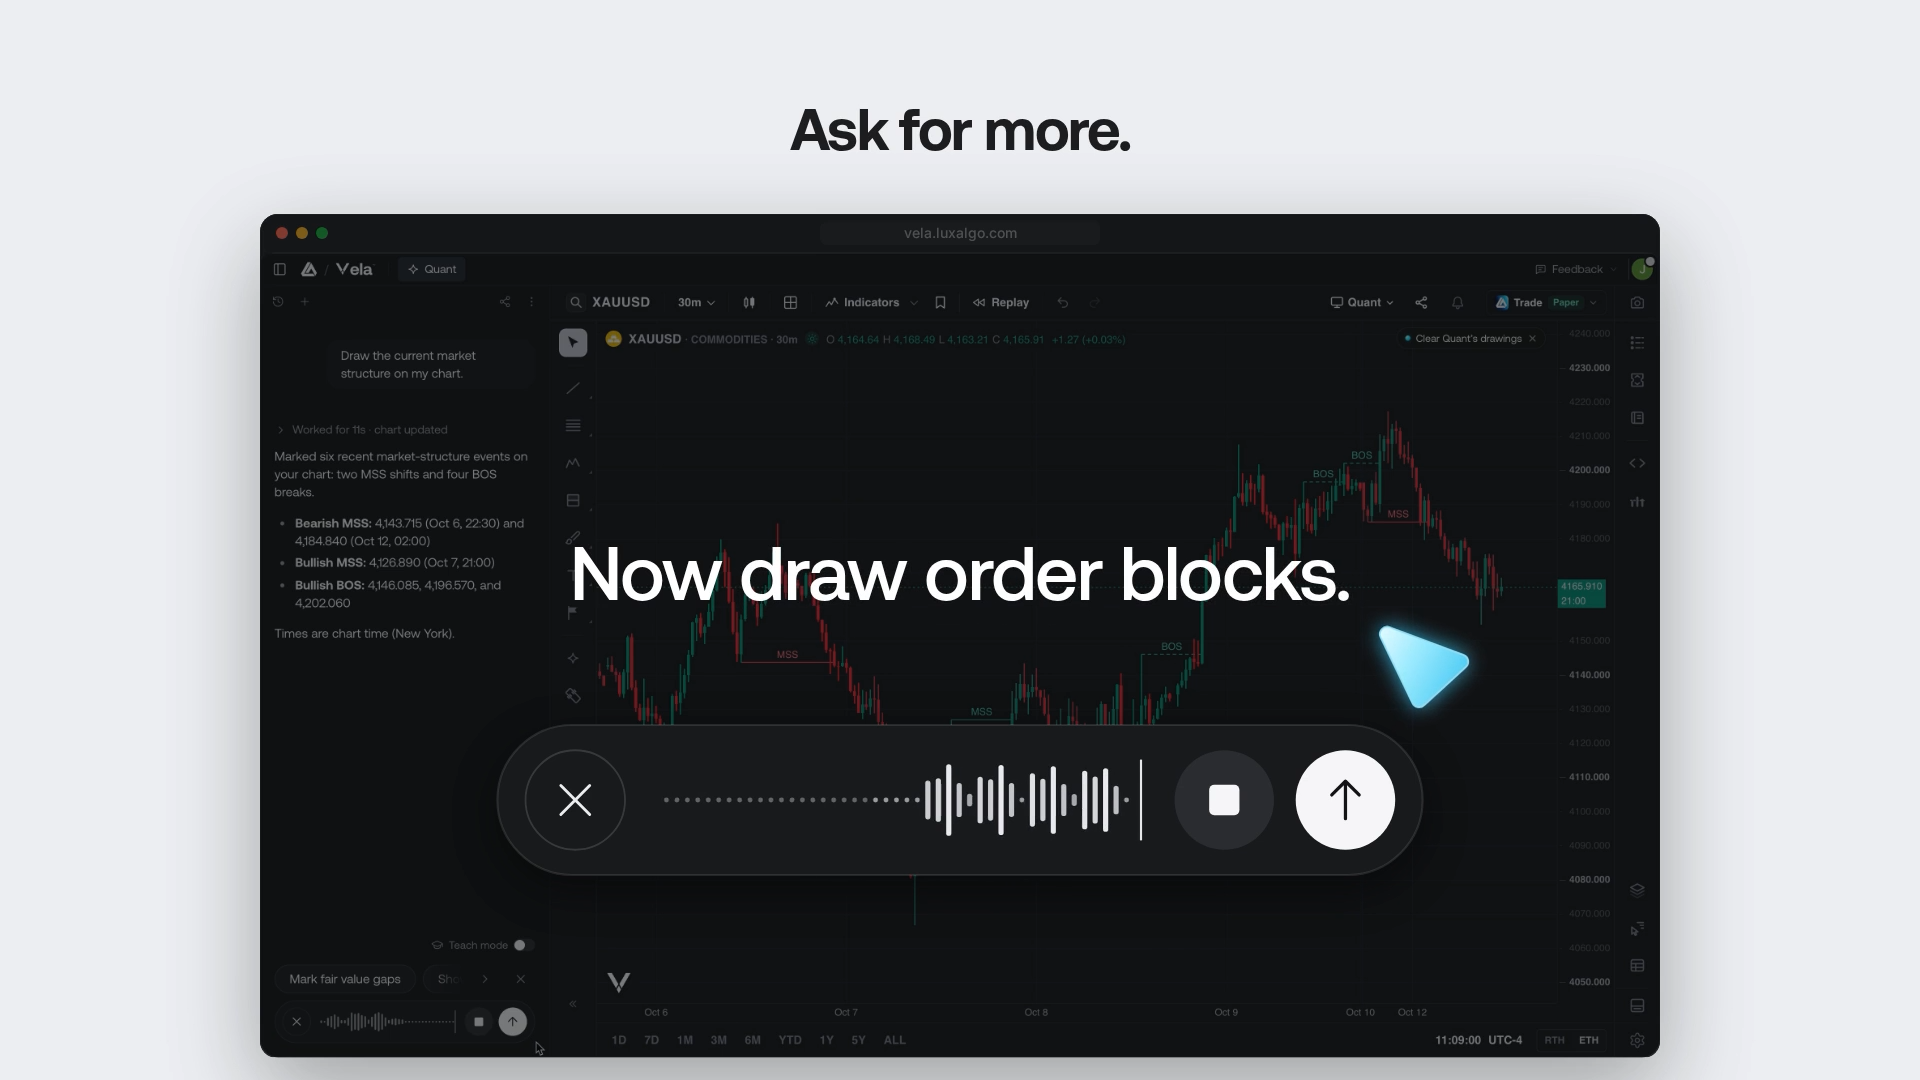
A few requests show how this fits together. "Draw the dealing range with OTE" gives you the range high and low, equilibrium, the premium and discount halves and the OTE zone in one pass. "Show today's killzones and the midnight open" lays out the session windows and the midnight open line before the New York session. "Draw a bullish continuation scenario to 2,925 with a setup note" produces a projected path with an arrow to 2,925 and a numbered note describing the setup, all as drawings you can adjust.
Sessions That Match the Market
Previous-day levels, opening gaps and killzones are only useful if the day is defined the way the market defines it. Quant handles trading sessions per market:
- Futures days roll at 18:00 New York
- Spot FX days roll at 17:00 New York
- Stocks use the calendar date
- Crypto uses the UTC day
That is what makes previous-day and previous-week levels, opening gaps and killzones line up correctly on ES, NQ, EURUSD, stocks and BTC. On ES, the previous day high comes from the session that rolled at 18:00 New York, not from a calendar day that splits the session in two. On BTC, the day is the UTC day.
US early closes are known too, including Black Friday, Christmas Eve and July 3, so a shortened session is treated as the short session it is rather than as a normal day with missing bars.
Drawings That Behave Like Yours
Quant's markup follows a consistent house style: thin lines, small labels at the right end, translucent fills, and one meaning per color. Drawings stay legible in both light and dark theme, and their colors follow the chart when you switch theme. Labels never overlap, and everything is drawn on the price chart itself.
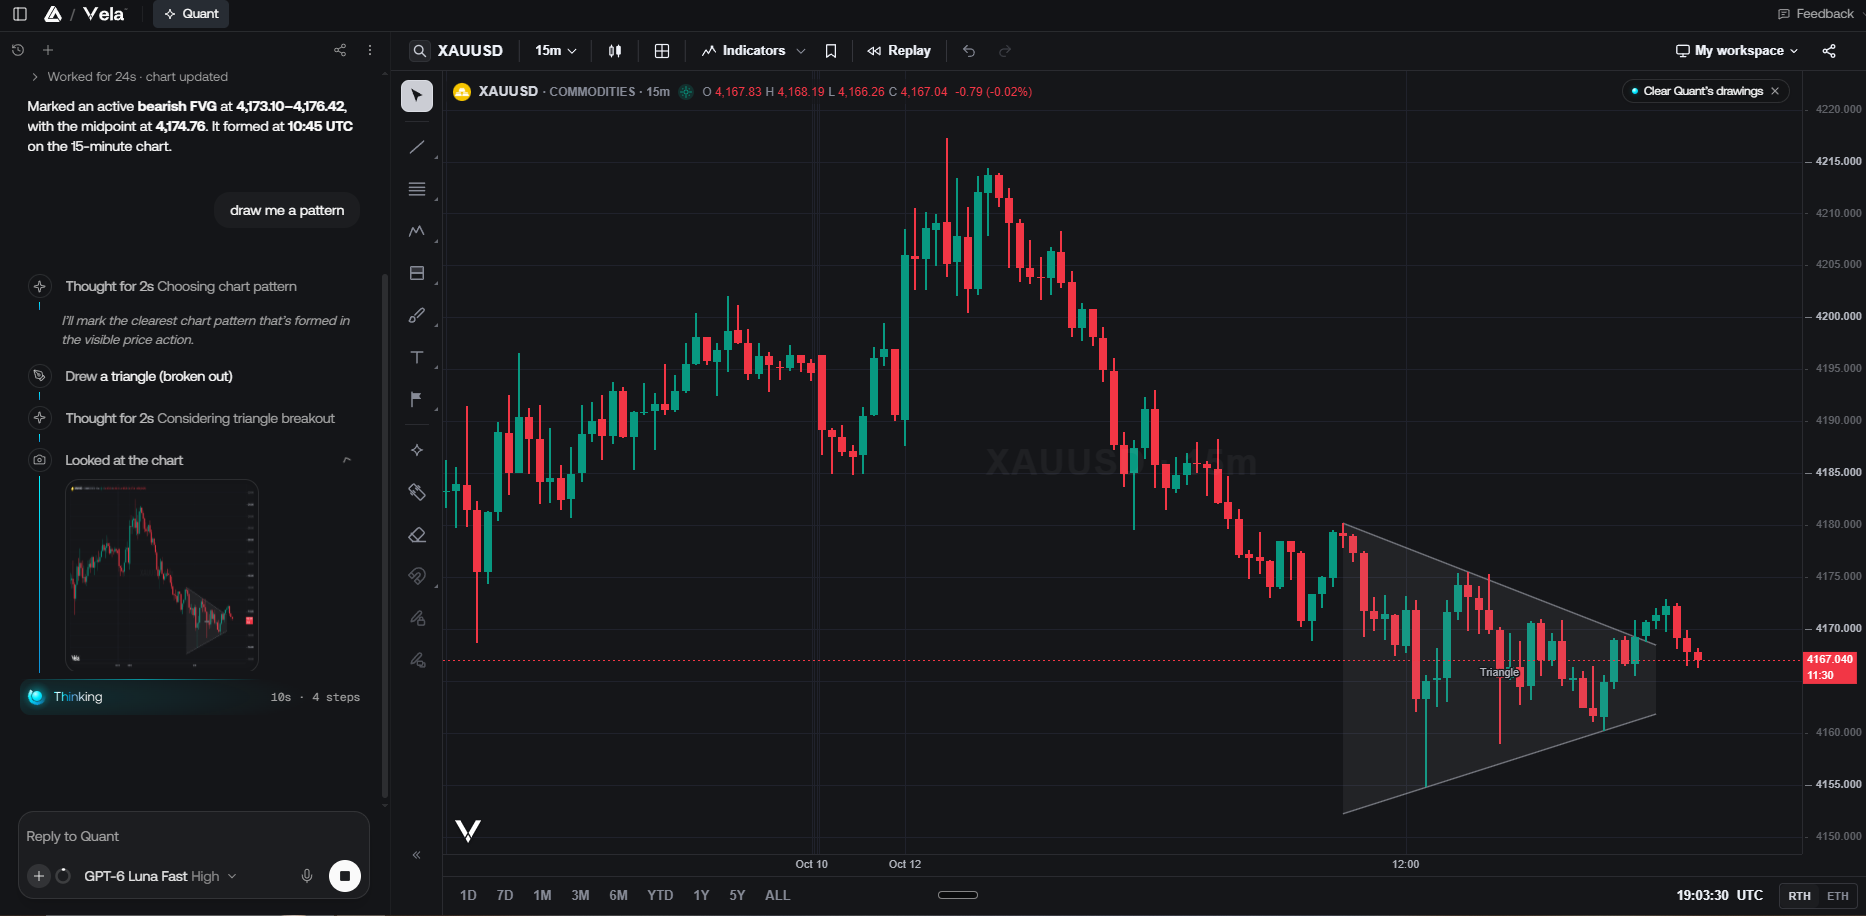
Your own drawings stay yours. Quant never touches the drawings you made, and drawing does not change the default style your next rectangle or line gets. A "Clear Quant's drawings" button removes only Quant's markup, and undo brings it back. When you ask Quant to redraw a concept, its new markup replaces its earlier markup of the same concept, and only once the new version has landed, so the chart is never left half-empty in between.
The guardrails are deliberate:
- Up to 60 drawings per request, and up to 150 Quant drawings per chart
- Heikin Ashi charts are refused with "switch the chart to candles", because those candles are not the real prices
- Pressing Stop takes back any half-finished markup
- Switching symbol or timeframe mid-drawing leaves nothing behind on the chart
Ask about your chart, adjust your scripts
Quant reads the chart you’re on, so a question like “what was the high of the 9:50 candle?” is answered from that candle, not estimated from a screenshot. It can also review a script’s plots or a strategy’s trades and results, and change a script’s settings for you without rewriting its code.
You can also change a script's settings without touching its code. Ask "try length 21 on my RSI" and Quant updates the input. Values are checked against the script's declared inputs, including type, options and min/max, and if any value is invalid, nothing changes. Comparing a few parameter values on the same chart becomes a matter of asking.
Quant also knows when a drawing is the wrong tool. It draws for analysis of the chart right now: today's setup, a scenario, or a concept being taught. When something has to update live on every bar, repeat across history, power alerts or be backtested, it offers in one line to write an indicator instead. For live concepts, it looks for an indicator in the LuxAlgo Library first, so you start from a published tool before anything new is written.
Try It on Your Chart
This is built for price action traders who mark up charts by hand every morning, and for anyone learning a concept who wants to see it drawn on a real chart rather than a diagram.
Open a chart at https://vela.luxalgo.com/chart, pick a symbol on candles, and ask Quant to mark it up. Start with something you already draw yourself, such as the fair value gaps and liquidity on NQ 1m or today's killzones and the midnight open, and compare its levels with your own. Every label shows the price it came from.
Read next