Concept
ICT Time Anchors
ICT Time Anchors, also known as true day, midnight open, 8:30 open, are Smart Money Concepts / ICT concepts. The Library holds 1 implementation, a working definition you can pull into Quant.
Top ICT Time Anchors indicator
The top custom implementation, built on the original standard ICT Time Anchors formula.
1 total
This ICT Time Anchors implementation is strategy-ready: open it in Quant, set your rules, and it backtests automatically.
What are ICT Time Anchors?
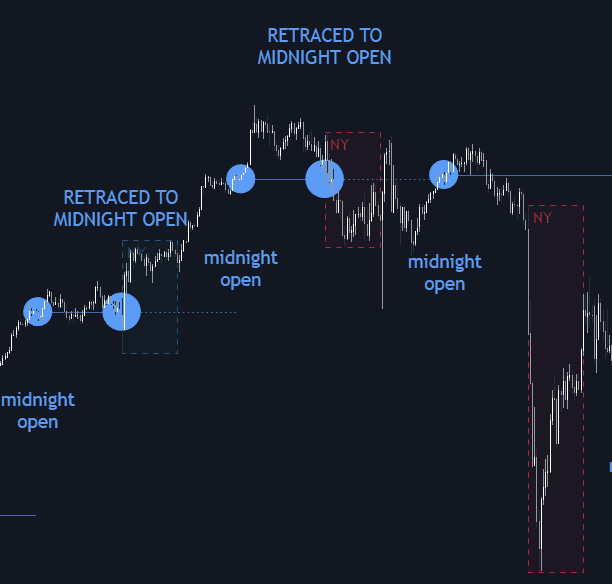
ICT time anchors are fixed New York-time reference points the ICT framework hangs the trading day on: chiefly the midnight open (00:00 New York time), which begins the "true day," and the 8:30 open, which coincides with the release time of many of the highest-impact US economic reports and sits one hour ahead of the 9:30 equities open. Each anchor contributes two things: a vertical divider (before and after that moment) and, more importantly, the opening price printed at it, extended forward as a horizontal level. The premise is that the algorithmic trading day is organized around midnight New York rather than the futures rollover or an exchange open (hence "true day"), so the day's range, bias, and manipulation are all measured from those opens.
The anchors matter because the opens act as dividing lines for reading intent. On a day expected to be bullish, the model wants the session low to form below the midnight or 8:30 open (an early push to a discount relative to the open, frequently a Judas swing) before price spends the rest of the day above it; bearish days mirror the logic. That is the power-of-three read of the daily candle (accumulation–manipulation–distribution) pinned to specific clock times. The anchors carry no direction by themselves; they define where "the wrong side of the open" is, so the rest of the toolkit has a fixed frame to work in.
How to mark ICT time anchors on a chart
The anchors are clock-defined, so marking them is mechanical; the only real failure mode is doing it in the wrong timezone.
- 1Set the chart's timezone to New York. The midnight open means 00:00 America/New_York; on a UTC or exchange-time chart the anchor lands on the wrong candle, which is the classic marking error.
- 2Find the 00:00 candle and extend its opening price forward as a horizontal ray. That line is the midnight open, the true day's opening price, and it stays relevant for the entire session.
- 3Repeat for the 8:30 candle, and for 9:30 if you trade equities or index futures. Each open gets its own ray, giving you the day's dividing lines before New York gets active.
- 4Read price against the rays inside the active killzone: on a day expected to be bullish, extended trade below the midnight or 8:30 open is where the model starts hunting the reversal leg, and the mirror applies on bearish days.
How traders use it
- As a bias check, the day's directional call is tested against the opens: a bullish read expects the low of the day to print below the midnight or 8:30 open and price to hold above them afterward, so sustained acceptance on the wrong side of the anchors is evidence the call is wrong.
- As manipulation framing: an early run below the opens (on an expected-bullish day) during London or the New York morning is treated as the candidate manipulation leg, and the reclaim back through the anchor is a common confirmation cue before entries are hunted.
- As the day's measuring stick: the high and low of the true day are counted from midnight New York, which is the range that ICT session ranges and day-range projections are built on.
- As a news filter, the 8:30 anchor flags the scheduled-data window: many traders stand down into an 8:30 release on macro event days and re-engage once price shows which side of the 8:30 open it accepts.
ICT time anchors vs nearby time concepts
Killzones: A killzone is a span of time (London open, New York AM) in which setups are hunted; a time anchor is a single clock moment whose opening price becomes a level that lasts all day. They're complements: the anchor says which side of the open price is on, the killzone says when that information is tradeable.
ICT Macros: Macros are short scheduled windows (twenty to thirty minutes around set times such as 9:50–10:10 New York) in which price is expected to reach for liquidity or rebalance an inefficiency. They describe expected behavior inside a window; anchors contribute a reference price rather than a behavior.
Period Opens: Period opens is the general idea: any daily, weekly, or monthly opening price used as a level. ICT time anchors are a specific New York-time subset (midnight, 8:30) with a bias framework attached: which side of the open price trades on is read as accumulation versus manipulation.
Concept family
Smart Money Concepts / ICT
54 concepts mapped · 54 in the Library
ICT Time Anchors FAQ
Turn ICT Time Anchors into a trading strategy.
Take the implementation from this page into Quant, then build on it, backtest it on real data, and keep refining it in conversation.