Rob Booker Pivot Points Indicator: Support and Resistance Levels
Pivot points are the oldest objective support and resistance levels in trading: a central pivot averaged from the prior period's high, low and close, with a ladder of resistance and support rungs reflected around it, all computed before the session opens. Rob Booker's Intraday Pivot Points, a TradingView built-in, keeps that arithmetic but shortens the anchor: instead of yesterday's session, the ladder is drawn from 60-, 240- or 480-minute periods, so a new set of levels appears several times a day. Booker's own emphasis is on the levels price never reaches. In his words, the "best examples of intraday pivots are the ones that are not hit by price", and those missed pivots become targets for the next move rather than levels to fade.
Key points:
- Fixed within the period, refreshed at each boundary: pivot levels do not move as price trades; a new ladder replaces the old one when the anchor period rolls.
- Shorter anchors, more ladders: 1-hour, 4-hour and 8-hour pivots put more levels on an intraday chart and make each one less widely watched.
- Missed pivots are targets: a rung no candle touched during its period is Booker's preferred objective, particularly for shorts after a reversal signal.
- Session convention decides the numbers: 24-hour and regular-hours data give different highs, lows and closes, so two charts can disagree without either being wrong.
The LuxAlgo Pivot Points and Pivot Points Standard indicators draw the classic ladders on Vela, our state-of-the-art charts, in one click, and Quant, our coding agent, can reproduce Booker's shorter anchors and test a pivot rule you can inspect in Code and run with Run.
How to Day Trade with Pivot Points: Video Walkthrough
TRADEPRO Academy published this walkthrough in November 2019. It covers the standard daily ladder and how intraday traders plan around it; treat any results shown as illustrations of the method rather than as evidence about performance.
How Pivot Points Are Calculated
Everything derives from three numbers: the completed prior period's high, low and close. The Library's floor pivots page traces the construction to the futures pits, where traders needed reference prices they could compute from yesterday's figures without a chart. Because the inputs are fixed facts of a finished period, the levels are objective: anyone with the same session data gets the same lines.
The Classic Ladder
- Central pivot: PP = (High + Low + Close) ÷ 3.
- First rungs: R1 = 2 × PP − Low; S1 = 2 × PP − High.
- Second rungs: R2 = PP + (High − Low); S2 = PP − (High − Low).
- Third rungs: R3 = High + 2 × (PP − Low); S3 = Low − 2 × (High − PP). Third-tier formulas vary by source, so two platforms can agree on everything except R3 and S3.
The table applies the formulas to a hypothetical stock whose prior session ran from $99.60 to $102.40 and closed at $101.80, near the top of its range. Because the close sat high, the central pivot lands above the range midpoint and the support rungs sit further from it than the resistance rungs.
| Level | Formula | Value | Distance from PP |
|---|---|---|---|
| R3 | $102.40 + 2 × ($101.27 − $99.60) | $105.73 | +$4.46 |
| R2 | $101.27 + ($102.40 − $99.60) | $104.07 | +$2.80 |
| R1 | 2 × $101.27 − $99.60 | $102.93 | +$1.66 |
| PP | ($102.40 + $99.60 + $101.80) ÷ 3 | $101.27 | 0 |
| S1 | 2 × $101.27 − $102.40 | $100.13 | −$1.14 |
| S2 | $101.27 − ($102.40 − $99.60) | $98.47 | −$2.80 |
| S3 | $99.60 − 2 × ($102.40 − $101.27) | $97.33 | −$3.94 |
Two details matter more than the arithmetic. First, the ladder is fixed for the whole period: nothing that prints today changes today's pivots, which is what makes them plannable. Second, the session definition decides the inputs. On futures and forex, regular hours versus the full electronic session changes the high, the low and the close, and the mismatch is the usual reason two traders' pivots disagree.
Booker's Intraday Variant
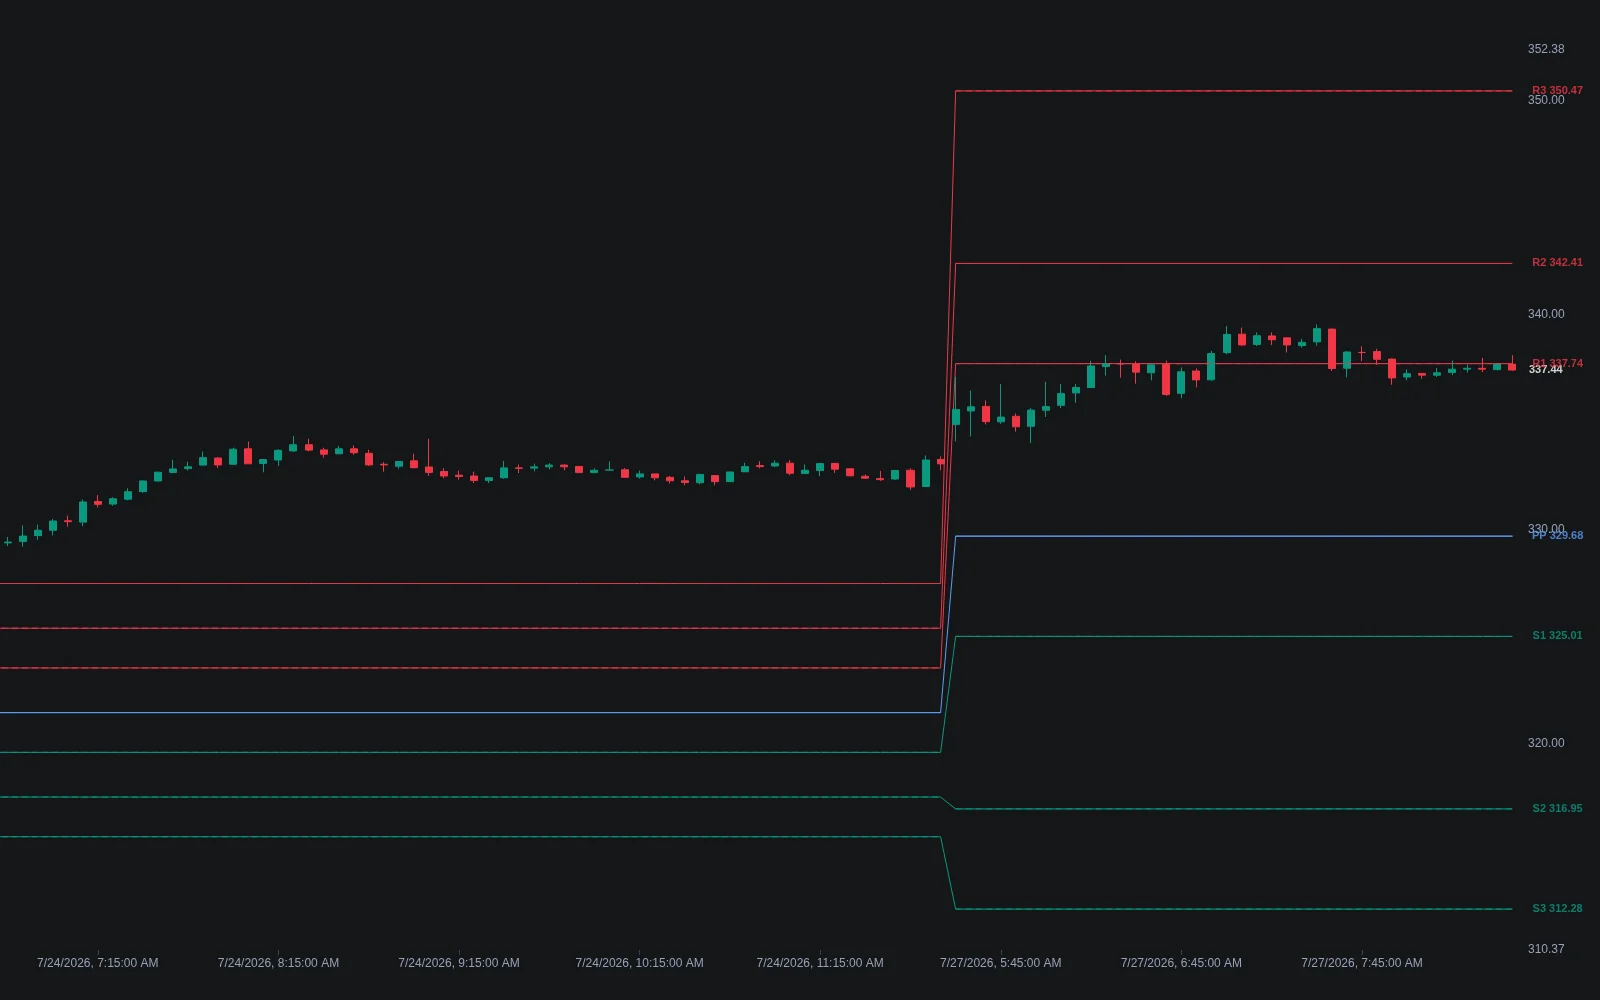
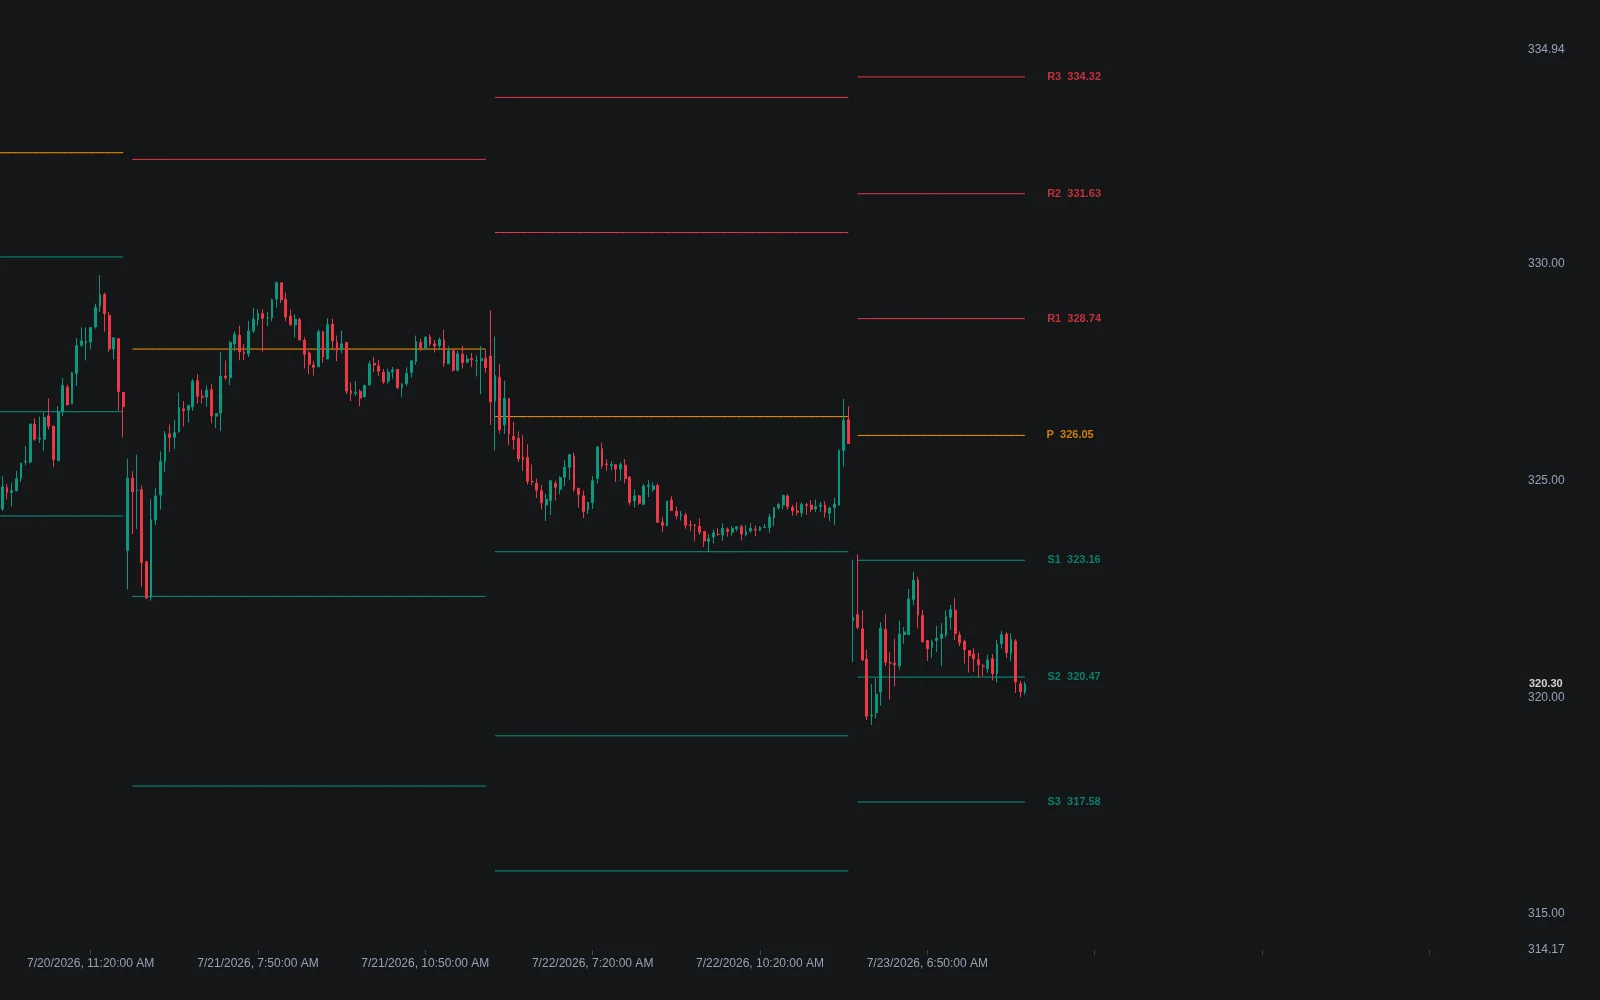
Rob Booker's Intraday Pivot Points indicator on TradingView applies the same formulas to shorter anchor periods. According to TradingView's help page, the inputs are a lookback period and a choice of 1-hour, 4-hour or 8-hour pivots (60-, 240- or 480-minute periods), with style settings for line width and colour. A 4-hour setting draws a fresh ladder from the previous four-hour bar's high, low and close every four hours; the levels are still fixed inside each period, they simply refresh more often than a daily set.
The trade-off is explicit. Shorter anchors put more levels on the chart and make each one more local: a 1-hour pivot is computed by fewer participants than a daily one and carries less of the self-fulfilling weight the daily ladder enjoys. Longer anchors move more slowly and are watched more widely. Traders who run two sets, for example 4-hour pivots for bias and 1-hour pivots for entries, are stacking the same construction at two scales rather than adding new information.
Missed Pivots
Booker's distinctive idea is the missed pivot: an intraday level that no candle touched from the beginning to the end of its period. The help page describes such a level as a target for the next period rather than a level to trade against, and specifically as an objective for short positions after a reversal has formed, with Booker's Knoxville Divergence indicator as the intended pairing. The reasoning is that a rung the market projected but never tested leaves an unresolved reference, and price often returns to it.
| Situation | How Booker's method reads it | What to check before acting |
|---|---|---|
| R1 of the last 4-hour period was never touched | A missed resistance pivot above price, a candidate target for a long | Price is below it now and a reversal or continuation signal has formed |
| S1 of the last 4-hour period was never touched | A missed support pivot below price, a candidate target for a short | A bearish reversal signal, in Booker's system Knoxville Divergence, has printed |
| Price trades through a missed pivot without pausing | The target is reached; the level has done its job | Do not assume the level will now hold as support or resistance |
| Several periods in a row leave pivots untouched on one side | Price is trending away from that side of the ladder | A trend day; fading rungs on the trending side is the classic pivot mistake |
The distinction from ordinary pivot trading is worth keeping sharp. Standard use treats rungs as places where price may react; Booker's missed pivots are places price has not yet been and may go. The first is a mean-reversion idea, the second a target-setting idea, and they call for different tests.
Trading the Ladder
Bias, Entries and Exits
The central pivot is the session's bias line. Trading above it with PP defended on dips is the conventional long lean; acceptance below it flips the read. The first test of PP, R1 or S1 in a period is the cleanest reaction point, before the level has been chewed through, and it is where most pivot traders concentrate. A long from S1 conventionally targets PP first and R1 second; a short from R1 mirrors that toward PP and S1. Because the whole ladder exists before the open, the reward-to-risk arithmetic can be fixed in advance, which is the main practical advantage over levels drawn by eye.
Stops belong to structure, not to the next rung by default. A stop for a long at S1 that sits just below S2 is often several times the distance to the first target, and the worked example below shows how quickly that erodes the trade. The tighter, more common placement is below the reaction low that formed at S1, with a small allowance for noise.
Confluence and Confirmation
A pivot that lands on an independently derived reference carries more weight than one sitting alone. Useful companions are references that use different inputs: a prior day high or low, which is an actual traded price rather than an arithmetic projection, a session VWAP, a round number or a volume node. The Library's confluence scoring page formalises the stacking. Momentum oscillators add a second kind of confirmation: an oversold reading at S1 or an overbought one at R1 says the push into the level is stretched, though in a trend that stretch can persist.
What confirmation does not do is turn the rung into a guarantee. Price action still has the final word: a strong rejection candle at the level, or a retest that holds after a break, is the entry trigger; the pivot alone is only the location. Buying a support rung because it is a support rung is the habit that makes pivot trading look worse than it is.
Range Days, Trend Days and Gaps
Pivots earn their reputation on rotational days, when price oscillates around PP and the S1-to-R1 band contains most of the session. On trend days price can march through the whole ladder, and the pivots' value then is in showing that this is happening: a one-sided open beyond R1 or S1 is the standard warning to stop fading and consider following. A false breakout through a rung that closes back inside is the mirror case and a common range-day entry.
Gaps distort the ladder. A large overnight gap can open the session above R2 or below S2, leaving most of the ladder irrelevant until a new period redraws it; this is one argument for Booker's shorter anchors on gappy instruments, since a 1-hour ladder catches up within the hour. Conversely, in thin markets, holiday sessions and illiquid small caps, there are too few participants for any projected level to matter much, and pivot reactions there are mostly coincidence.
A Worked S1 Trade with Position Sizing
Consider the ladder above on a 5-minute chart, a $25,000 account and a 1% risk budget of $250. Price opens near PP, sells off to S1 at $100.13, prints a reaction low at $99.80 and closes a strong bounce candle back above S1. The rule is a long on the first test of S1 confirmed by the bounce close, with the stop below the reaction low and the first target at PP. See Risking It Right for the budgeting logic.
| Step | Calculation | Result before costs |
|---|---|---|
| Entry | Bounce candle closes at $100.30 after the first test of S1 ($100.13) | Buy $100.30 |
| Stop below the reaction low | $99.80 low minus a $0.55 allowance | Stop $99.25; $1.05 risk per share |
| Position size | $250 ÷ $1.05, rounded down | 238 shares; $249.90 planned risk; $23,871 notional |
| First target PP | $101.27 − $100.30 | $0.97 reward, about 0.9R; a scale-out point, not a full exit |
| Second target R1 | $102.93 − $100.30 | $2.63 reward, about 2.5R |
| Stop below S2 instead | $98.37 stop; $1.93 risk per share | 129 shares and the PP target falls to 0.5R; the wide stop is what makes many pivot trades unprofitable |
| Gap through the stop, fill at $98.90 | 238 × ($100.30 − $98.90) | $333.20 loss, about 1.3R; a stop level is not a guaranteed fill |
The ladder supplies the location and the targets, the reaction low supplies the stop, and the stop distance supplies the size. Notice that a long from S1 to PP alone is under 1R at a sensible stop; the trade needs R1 in reach, or an unusually tight structure at S1, to be worth taking. Whether first tests of S1 reach PP or R1 often enough on your instrument is a question the test answers.
Pivot Points on Vela
Two Native Pivot Indicators
The Library's Pivot Points is the classic floor-trader ladder with a history. Anchor Period defaults to Auto, which picks Daily on intraday charts, Weekly on daily charts and Monthly above that, or can be pinned to any of the three; Support/Resistance Rungs draws one to three pairs; Periods Shown (default 5) keeps past ladders on the chart so you can review how price treated earlier projections before leaning on today's. Its alerts cover closes through every rung out to R3 and S3, ignore crossings on the re-anchoring bar because those come from the level jump rather than a price move, and add First Test of PP, R1 and S1, which is exactly the reaction point most pivot traders wait for.
Pivot Points Standard is the multi-formula build. Type defaults to Traditional with Fibonacci, Camarilla and Woodie options (Traditional and Fibonacci plot three rungs a side, Camarilla four, Woodie two), and Pivots Timeframe on Auto maps 15-minute charts and below to daily pivots, other intraday charts to weekly, daily charts to monthly and weekly or monthly charts to yearly, or can be pinned. Alerts cover price crossing the pivot, R1 and S1. Neither indicator draws Booker's 60-, 240- or 480-minute ladders directly; that is a job for Quant.
| Tool | What it adds | Where it runs |
|---|---|---|
| Pivot Points | Classic ladder with past periods kept on the chart, first-test and cross alerts | Vela, from the Library page |
| Pivot Points Standard | Traditional, Fibonacci, Camarilla and Woodie formulas with an automatic anchor | Vela, from the Library page |
| Fibonacci Pivots | Rungs projected at Fibonacci ratios of the prior range | Vela, from the Library page |
| VWAP | A volume-weighted session reference for confluence with the ladder | Vela, from the Library page |
| Support and Resistance Levels with Breaks | Swing-based levels drawn from actual price, a check on projected rungs | Vela, from the Library page |
Testing a Pivot Rule with Quant
Write the rule completely: the anchor period (daily, or Booker's 60, 240 or 480 minutes), the session convention, which rung is traded, what counts as a first test, the confirmation candle, the stop below the reaction low, the targets and the position sizing. Describe it to Quant, inspect the Code to confirm the ladder is computed from the completed prior period and the confirmation is evaluated on closed bars, and click Run. The Making Strategies with Quant guide shows the workflow, and the native backtest guide explains the Backtest Summary: net profit, trade count, win rate, maximum drawdown and profit factor, with commission and slippage set in the strategy properties.
Three comparisons are worth running. Daily pivots against 4-hour pivots on the same rule, to see what the shorter anchor buys and costs. First tests of S1 and R1 against every test, to see whether the first-test discipline matters. And a missed-pivot target rule against a fixed-R target, which is the honest way to test Booker's central claim. Read trade count and the range-day versus trend-day split before headline return, and hold out data the anchor choice never saw. A signal from another tool at a rung is confluence to test rather than confirmation, and the LuxAlgo platform does not place orders for you.
Strengths and Limitations
| Aspect | Strength | Limitation |
|---|---|---|
| Objectivity | Same inputs, same lines for everyone; no discretion in drawing | Levels are projections, not prices where trading occurred |
| Planning | Whole ladder known before the open, so risk and targets are fixed in advance | Gaps can open the session outside the useful part of the ladder |
| Intraday anchors | Booker's 1-, 4- and 8-hour sets refresh through the day and suit shorter holds | Each shorter ladder is computed by fewer participants and carries less weight |
| Missed pivots | A clear, testable target rule | No public evidence that untouched rungs are reached more often than chance; test it |
| Regime | Excellent frame on rotational days | On trend days price slices the ladder; fading rungs then is the classic error |
| Data | Cheap to compute on any feed | Session convention changes every level; thin markets make the levels meaningless |
Conclusion
Pivot points survive because they are arithmetic everyone can reproduce: a central pivot and a ladder of rungs from the prior period's high, low and close, fixed for the session and refreshed at the boundary. Rob Booker's intraday variant shortens the anchor to 60, 240 or 480 minutes and adds one genuinely distinctive idea, the missed pivot as a target. Treated as locations for planned, structure-stopped trades with confluence and a regime read, pivots are a disciplined framework. Treated as levels that owe price a reaction, they fail exactly when the market is trending.
Key Takeaways
- Fixed, not dynamic. A ladder never moves inside its period; it is replaced when the anchor rolls, more often with Booker's short anchors.
- The session decides the numbers. Regular-hours and 24-hour data yield different ladders on the same symbol.
- Missed pivots are targets. Booker's rule treats untouched rungs as objectives after a reversal, not as levels to fade.
- Stops come from structure. A stop parked below the next rung usually destroys the reward-to-risk; use the reaction low.
- Native and testable. Pivot Points and Pivot Points Standard draw the ladders on Vela with first-test and cross alerts, and Quant can build Booker's intraday anchors and test the rule.
FAQs
How is Rob Booker's Intraday Pivot Points indicator different from standard pivot points?
The formulas are the same; the anchor period is shorter. Standard pivots use the prior day, week or month, while Booker's TradingView indicator offers 1-hour, 4-hour or 8-hour periods, so a fresh ladder appears several times a day. Within each period the levels are fixed. Booker also emphasises missed pivots, rungs no candle touched, as targets.
What is a missed pivot?
An intraday pivot level that no candle touched from the start to the end of its period. TradingView's help page for the indicator quotes Booker calling these the best examples of intraday pivots and describes them as price targets, especially for shorts after a reversal signal such as his Knoxville Divergence.
Do pivot points recalculate in real time?
No. A ladder is computed once from the completed prior period and holds until the next period begins, which is what makes it plannable. Booker's indicator refreshes more often because its anchor is shorter, not because the levels move with price.
Why do my pivot levels differ from another platform's?
Usually the session definition differs. Regular-hours and full electronic-session data give different highs, lows and closes on futures and forex, and 24-hour markets need an explicit day boundary. Third-tier formulas for R3 and S3 also vary by source. Confirm the session and the formula set before comparing.
Which pivot formula should I use?
There is no demonstrated best. Traditional is the classic floor-trader ladder and the one most participants compute; Fibonacci suits traders who work in retracement ratios; Camarilla gives tighter rungs around the prior close for intraday mean reversion; Woodie weights the current open. Pick one, learn how your market behaves around it and stay consistent.
Can I draw and backtest pivot points on Vela?
Yes. Open Pivot Points or Pivot Points Standard from the Library with Open in Vela to draw the daily, weekly or monthly ladders with first-test and cross alerts. For Booker's 60-, 240- or 480-minute anchors and for a testable rule, describe the anchor, session, rung, confirmation, stop and targets to Quant, inspect the Code and click Run.
References
LuxAlgo Resources
- Vela
- LuxAlgo Quant
- Pivot Points Indicator
- Pivot Points Standard Indicator
- Fibonacci Pivots Indicator
- VWAP Indicator
- Support and Resistance Levels with Breaks
- Pivot Points Concept
- Floor Pivots
- Prior Period Levels
- Session VWAP
- Round Numbers
- Confluence and Scoring Systems
- Retest
- False Breakout
- RTH vs ETH
- Making Strategies with Quant
- Native Backtest Guide
- Risking It Right
- Support and Resistance Basics in Range-Bound Markets
- Market Structure Breakouts for Intraday Trading
External Resources
Read next