Supply and Demand Zones: A Simple Guide
Supply and demand zones are price areas traders mark around structures that preceded a strong decline or rally. A supply zone is a candidate area for selling interest on a return; a demand zone is a candidate area for buying interest. They can help organize entries, stops, and targets, but they do not reveal traders' identities or guarantee that price will reverse.
This guide explains how to draw a zone, choose an entry approach, and calculate the risk of being wrong. You can follow the process on LuxAlgo, a charting and AI platform: use Quant Charts to inspect price and volume, then work with Quant, our coding agent, to turn a clearly described idea into a strategy you can review and backtest.
- Supply: look for a defined base followed by a downward departure.
- Demand: look for a defined base followed by an upward departure.
- Timing: a zone based on a departure is only known after that departure occurs.
- Risk: decide where the idea fails before deciding how much to trade.
Finding Zones on Price Charts
Spotting supply zones
Start with a sharp decline and work backward to the consolidation immediately before it. That base is one candidate supply area. A rally followed by a base and a drop is called Rally-Base-Drop; a decline, base, and further decline is a continuation variant.
Choose the candles that define the base and record their upper and lower bounds. Full candle ranges and candle-body-only ranges produce different zones, so use one convention consistently. A failed attempt to move above a prior high can add context, but it is not required by every zone method.
Spotting demand zones
For demand, find a base followed by a strong upward move. Drop-Base-Rally describes a decline into the base followed by a rally. The preceding decline is part of that pattern; a base and rally alone do not establish the full sequence.
| Question | What to record |
|---|---|
| Where is the base? | The exact candles and the boundary convention |
| What counts as departure? | A specified close beyond the base, with any chosen size or volume requirement |
| When is the area usable? | After the departure condition becomes known, not back at the first base candle |
| When does it stop being usable? | A defined break, age limit, or number of returns |
Illustrative gold example: suppose a base spans $1,700–$1,710 and price subsequently rallies to $1,750. The base is a candidate demand area under that drawing convention. The $50 move alone does not establish its boundaries or prove that a later return will bounce. These are hypothetical prices, not a reported historical trade.
Zones and support/resistance overlap
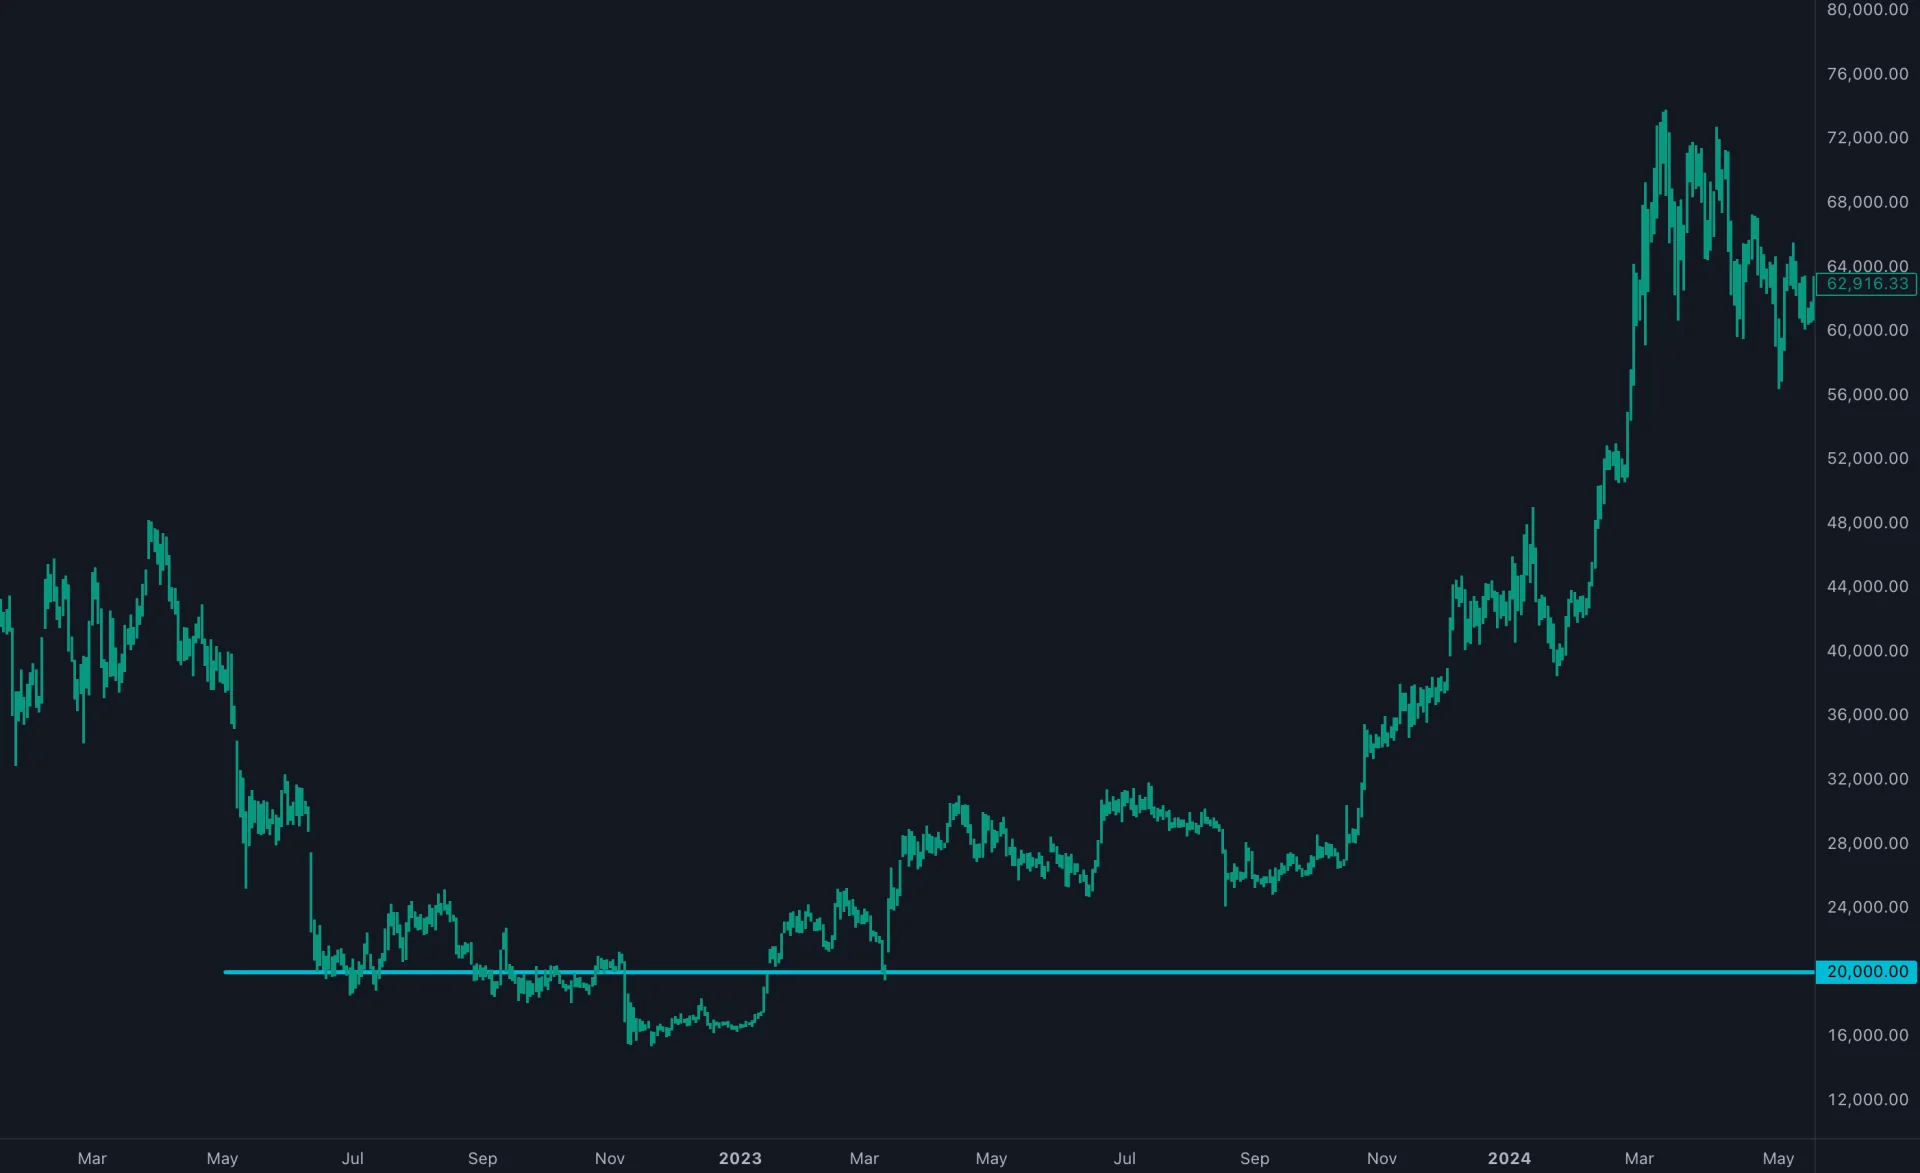
Support and resistance are also often treated as areas, not exact prices. Supply/demand analysis commonly emphasizes a base and departure, while other level methods may emphasize prior highs, lows, or repeated reactions. Neither label establishes a higher success rate. Fidelity's support and resistance guide explains how a broken area may later change roles and why technical analysis remains interpretive.
Choosing a timeframe
Daily or weekly charts can provide broader context; four-hour or one-hour charts can show more detail around an entry. Choose intervals that match the intended holding period and available data. There is no universally best timeframe for a zone.
If you identify a daily zone and enter on an hourly chart, retain the daily boundaries and specify the hourly trigger. Do not use the final value of an unfinished daily candle as though it were known earlier. Overlapping zones across intervals may be interesting, but they are not necessarily independent confirmation.
Trading with Supply and Demand
Three ways to enter
| Approach | Example | Main trade-off |
|---|---|---|
| Touch entry | Place a predefined order at a demand-zone boundary | Can obtain an earlier price, but the decline may continue; touching a price does not ensure a limit fill |
| Rejection entry | Wait for a completed candle to enter the zone and close back above its upper edge | Waits for a reaction, but the next available entry may be farther from the stop |
| Breakout entry | Wait for a completed close beyond supply, then trade the break or a separately defined retest | The break can fail; a retest may never occur |
For a short setup, reverse the directional conditions and account for borrow availability and fees. Avoid calling a close-based approach “safe”: waiting changes the entry price and frequency, but does not eliminate loss.
Whichever approach you choose, define whether a wick through the far edge invalidates the zone or whether a close is required. Do not switch definitions after seeing whether the trade recovered.
Setting stops, size, and targets
A stop beyond the far side of a zone is one possible invalidation rule. A volatility buffer changes the risk distance, so it must also change position sizing. A commonly discussed 1–2% account-risk rule is a sizing convention, not a level suitable for everyone or a guarantee about the maximum loss.
Consider a demand zone from $48 to $50. Suppose a rejection is followed by an actual entry at $50.50, with a planned stop at $47.50. The initial risk distance is $3 per share.
- A $90 planned risk budget allows 30 shares before costs.
- The position value is 30 × $50.50 = $1,515, separate from the planned $90 stop risk.
- A hypothetical 2R target is $56.50: $6 per share or $180 gross profit if every share exits there.
- If adverse execution produces an exit at $45.50, the actual loss is $150 before costs.
Allow for commissions, spreads, slippage, and available buying power. Futures and forex require the appropriate contract or lot value and currency conversion. The SEC's stop-order bulletin explains why stop prices are not guaranteed fills; a stop-limit order can fail to execute.
Previous swing highs/lows and opposing zones are possible target references. Mark them using information available when the trade is planned. A 2R target does not make a strategy profitable by itself: with full 2R winners and 1R losers, the break-even win rate is one-third before costs. Different exits, costs, and gap losses change that calculation.
Adding other technical tools
Choose each additional tool for a distinct question:
- Volume: how much activity occurred relative to a defined baseline? A spike does not establish institutional participation or a valid zone.
- Moving averages: how does price relate to a selected trend reference, such as a 50-period average? Specify the average type and timeframe.
- RSI or MACD: does a defined momentum condition change the strategy's results? Divergence is a hypothesis, not proof that a zone will hold.
- Fibonacci drawings: where do chosen retracement levels fall within a specified swing? Their prices depend on the anchors.
Compare the same strategy with and without a filter, on the same market and dates. More indicators can reduce the number of trades without improving the outcome.
Technical Tools for Zone Analysis
Draw or calculate zones on Quant Charts
LuxAlgo's native drawing tools let you mark chart structures and retain them in a workspace. Begin with the area your method actually defines. Premium/discount bands, order blocks, price gaps, and supply/demand bases are different constructions; similar-looking rectangles do not make their rules interchangeable.
For a calculated alternative, open Supply and Demand Anchored from the Library on Quant Charts. It estimates areas from volume within a selected start and end window. Threshold, resolution, and intrabar timeframe affect the result; moving an anchor recalculates it. This differs from manually drawing a consolidation base. In historical evaluation, the selected window must end before the decision you are studying.
Volume analysis tools
A volume profile describes activity at prices over a chosen window. High-volume areas show where more trading accumulated; they do not reveal resting orders or establish future support. LuxAlgo's native volume profiles include session, rolling, and visible-range versions.

Session and rolling profiles require footprint data. Visible Range Volume Profile uses candle volume and an up/down-bar split, and changes as you pan or zoom. Do not use a session's final profile levels before the session has ended when reviewing historical entries.
Testing with LuxAlgo Quant
Quant, our coding agent, can help build a strategy from your zone idea. Give it conditions rather than a request to “trade strong zones.” Start with one zone method and one entry approach:
- Define formation: which candles make the base, what departure is required, and when the zone becomes known.
- Define eligibility: first return or repeated returns, zone age limit, and priority when several zones overlap.
- Define the trade: signal timing, earliest execution, stop, target, sizing, and handling of gaps or simultaneous stop/target touches.
- Review the code and trades: check that historical zones were available at entry and that fills follow the intended rules.
- Evaluate: inspect trade count, drawdown, net profit, and profit factor; include costs and reserve a later period for checking the selected rules.
The native backtest viewer provides the performance summary and individual trades. Inputs and simulation properties let you adjust exposed parameters and costs. A script running successfully is not proof that the strategy is realistic or profitable, and historical simulation is not live trade execution.
Top Mistakes to Avoid
Changing zone width to fit the result
Overly broad areas can hide weak definitions and require a larger stop distance. Arbitrarily narrow areas can exclude normal variation. Use a consistent boundary method and compare alternatives separately. Save the original zone before its next test instead of moving it after price reacts.
Mixing timeframe rules
Using one timeframe for context and another for entry is not inherently a mistake. The problem is changing which timeframe controls the stop, signal, or invalidation without a plan. Record each role and avoid using unfinished higher-timeframe data as a completed result.
Treating a label as validation
Automated indicators make rules easier to apply consistently, but the rules still need checking. Manual inspection can also introduce hindsight. Review failed zones, save formation timestamps, and distinguish a chart label from an executable trade.
Getting Started
Pick one market and timeframe, mark a small set of historical zones with the same definition, and record both holds and failures. Then write down an entry, stop, target, and sizing rule before testing a larger period. Keep notes on deviations and costs, and use a later sample to evaluate rather than repeatedly selecting the best-looking historical settings.
For a more detailed treatment of zone construction and reversal, continuation, and reclaim methods, read identifying critical supply and demand areas. The original Trading Academy zone-strategy video is also available as an independent tutorial; its promotional claims are not evidence of expected returns or documentation of current LuxAlgo features.
FAQs
How can you identify a trading zone?
Choose a base that precedes a defined directional move, mark its upper and lower boundaries consistently, and record when the departure made the zone identifiable. Specify how a later return is traded and what invalidates the area. Rejection candles and volume can add context, but do not establish that a zone will hold.
Which indicators work best for finding supply and demand zones?
No single indicator is universally best. A zone indicator applies its own construction rules, volume profiles describe activity by price, and Fibonacci or momentum tools provide separate references. LuxAlgo's Library offers methods such as Supply and Demand Anchored, while Quant can help translate explicit conditions into a strategy to review and test. Combining tools does not automatically improve results.
How do you locate supply and demand zones in forex?
Use the same clear base, departure, and boundary rules on a specified currency pair and timeframe. Round numbers such as 1.3000 on EUR/USD can be references, but are not zones by themselves. Spot-forex volume is feed-dependent rather than a consolidated measure of the entire market. Check the data source and costs; LuxAlgo's current forex charts use candle data rather than native footprint data.
See LuxAlgo's market-data coverage for supported markets and order-flow availability.
References
Read next