Swing Trading Strategies: Profiting from Market Volatility
Swing trading seeks to capture price movements over several days or weeks. Traders may follow a trend, trade an established range, or enter after a breakout. Volatility creates movement to study, but it also increases uncertainty, stop distances and the risk of overnight gaps.
You can inspect those conditions on Vela, our next-generation charting platform, and develop explicit rules with Quant, our coding agent. Start with one setup you can explain and reproduce, then evaluate its trades, costs and failures before adding more indicators.
Key Points
- Choose between trend, range and breakout methods according to defined market conditions.
- Use indicators for distinct questions: trend, momentum, volatility and participation.
- Calculate size from the planned loss per unit and allow for execution costs.
- Holding through nights and weekends introduces risks that a stop price cannot eliminate.
- Historical win rates and attractive examples do not guarantee future returns.
Swing trading may require less screen time than intraday trading, but it still needs regular review. Fewer trades can reduce some transaction costs while longer holding periods can add financing, borrow costs or event exposure. Neither moderate volatility nor a larger potential move makes a strategy profitable by itself.
Key Technical Indicators
Moving Averages
Moving averages smooth the selected price series. A simple moving average gives equal weight to observations in its window; an exponential moving average weights recent observations more heavily. Both lag price and can generate repeated crossings in sideways markets.
| Example length on a daily chart | Possible role | What to verify |
|---|---|---|
| 200 bars | Broader trend context. | Whether the strategy requires price above the average, a rising slope, or both. |
| 50 bars | Intermediate trend or pullback reference. | Averages are dynamic references, not guaranteed support or resistance. |
| 10–20 bars | Shorter swing timing. | A faster response can also produce more false signals. |
These are common examples, not optimal settings. A 20-period average on an hourly chart measures 20 hourly bars, not 20 days. State the source, length and timeframe in the trading plan. Buying every close above a 10-day EMA is a different strategy from waiting for a pullback and a later reversal trigger.
RSI Trading Guide
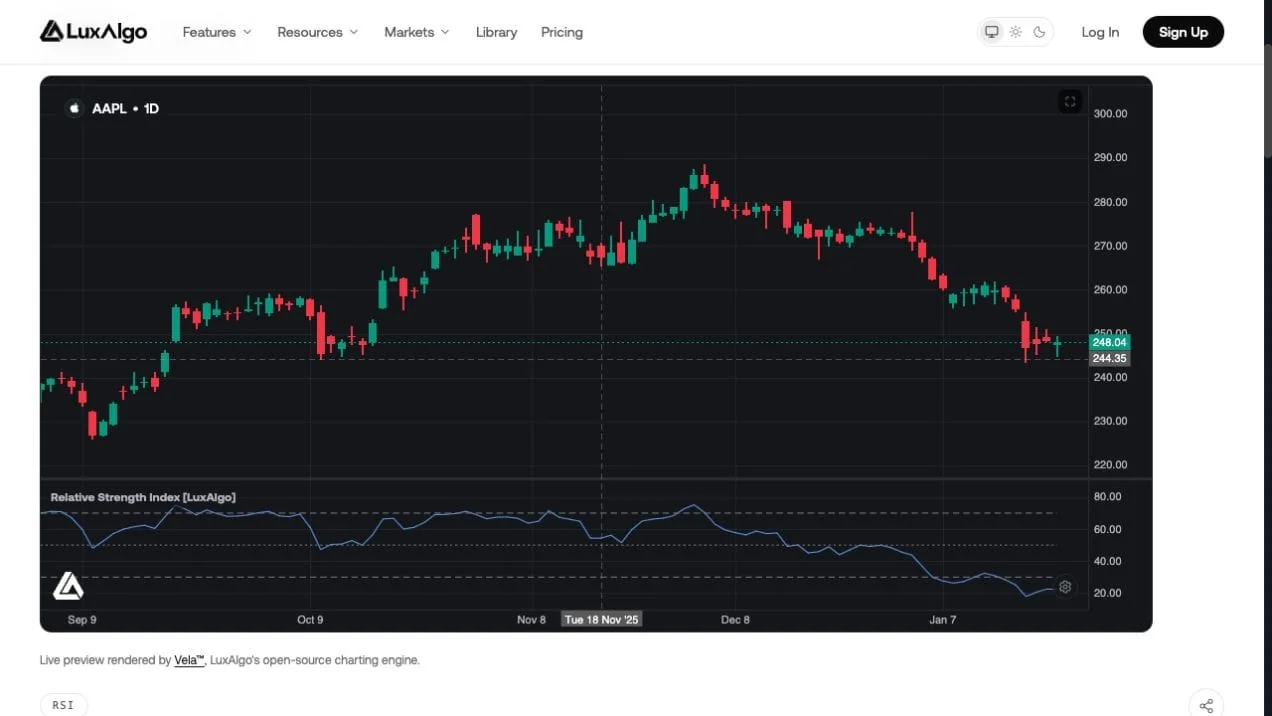
The LuxAlgo Relative Strength Index Library tool uses the standard bounded oscillator, with a default length of 14, close as its source, and 70/30 thresholds. It compares smoothed gains with smoothed losses. It does not assign a probability that a trade will win.
Readings above 70 are conventionally called overbought and below 30 oversold. Strong trends can remain near an extreme, so those levels are not automatic sell and buy instructions. A return through a threshold, a divergence or a midline condition needs its own definition and evaluation.
Changing thresholds to 15 and 85 makes them more extreme. It does not automatically capture swings sooner. Changing the RSI length is a separate adjustment that affects sensitivity. Test each choice without selecting only the setting that worked on the most recent chart.
Using Bollinger Bands
Bollinger Bands place volatility-based bands around a moving average. A narrowing band width describes contraction but does not predict the direction of the next break. A close above the upper band can occur during an advancing trend; a lower-band close can occur during a decline.
John Bollinger’s rules emphasize that touching a band is not a standalone buy or sell signal and that price can move along a band in a trend. The common 20-period, two-standard-deviation settings are defaults, not a guarantee of price containment.
For example, a proposed long breakout might require a completed close above the upper band after a defined period of low band width. An RSI reading around 55 or a volume increase can be tested as a filter, but neither makes that breakout reliable automatically.
Volume Analysis
Volume describes activity on the selected feed. Compare a breakout’s activity with an appropriate baseline and record the session. Low volume near an extreme is not sufficient evidence of reversal, and high volume does not guarantee a durable trend shift.
For a currency pair, broker tick volume or exchange-specific futures volume is different from a complete measure of global spot-FX buying and selling. A close beneath a lower band with RSI below 30 could be momentum continuation or an extended move; the entry and exit rules determine which hypothesis is being tested.
Three Swing-Trading Strategies
Trend Trading Method
- Define the trend: use price structure or a measurable moving-average condition.
- Define the pullback: specify its depth, duration and reference level rather than buying any decline.
- Wait for the trigger: for example, a completed recovery close followed by an entry at the next open.
- Plan the exit: identify the invalidation, target or time limit before entry.
A prior swing high can be a target reference for a long position, but it may leave little room after the actual fill. A trailing stop follows a defined rule; gaps and slippage can still prevent it from preserving the apparent open profit.
Trading Price Ranges
Mark support and resistance from repeated observations available before the trade. A potential long near the lower boundary requires a specified rejection or recovery; a short near the upper boundary needs its corresponding condition. Decide what cancels the range assumption when price breaks out.
Scaling in is optional and increases exposure. Set the total planned risk for all entries rather than treating each addition as an unrelated trade. Repeatedly adding to a losing position can turn a small range failure into a large loss.
Trading Market Breakouts
Define the boundary from prior bars, then specify whether a wick, completed close, buffer or retest activates the setup. A next-open entry and an intrabar stop entry can have materially different results. A pullback after the break is not guaranteed to occur.
Volume and momentum filters should be tested against the same baseline. Put the stop where the setup is invalidated under the plan, rather than automatically placing it a tiny distance beyond the breakout line. If that stop is too wide for the risk budget, reduce size or skip the trade.
Risk-Management Rules
Position-Size Calculator
For a simple share position, units = planned risk budget ÷ absolute difference between entry and stop. Round down to the permitted lot size and allow for costs. For futures, forex or other contracts, include the point or pip value and currency conversion; the share formula alone is insufficient.
With a hypothetical $20,000 account, a chosen 1% risk budget equals $200. If entry and stop are $2 apart, that permits 100 shares before costs. This is an arithmetic example, not a required allocation. Account buying power, concentration and correlated positions can constrain size further.
If volatility leads you to widen the stop to $4 while retaining the $200 budget, size falls to 50 shares. Widening the stop after entering without reducing exposure increases the amount at risk.
Stop-Loss Placement
Average True Range (ATR) measures the magnitude of movement, including gaps from the previous close. It does not predict direction. Specify its length and smoothing before using a multiple as a stop buffer.
A stop beneath support for a long, or above resistance for a short, is one possible structural rule. An ATR-based stop is another. State whether the distance is fixed at entry or updated, and whether a trailing rule can move only toward the market. ATR in price units and ATR expressed as a percentage are different inputs.
For an entry at $50 with a $48 stop and 100 shares, planned price risk is $200. If an overnight gap produces a $46 fill, the loss is $400 before costs. Review earnings, economic announcements, liquidity and weekend exposure before deciding to hold.
Risk vs. Reward
A $54 target on that $50 entry offers $4 per share against $2 planned risk, or a reward-to-risk ratio of 2:1. Realized exits can differ from the target. Use consistent notation: reward-to-risk 2:1 is the same comparison as risk-to-reward 1:2.
| Hypothetical setup | Gross expectancy per trade | Interpretation |
|---|---|---|
| 33% winners, average win 5R, average loss 1R | 0.33×5R − 0.67×1R = 0.98R. | A lower win rate can be profitable if the stated payoffs are achieved. |
| 60% winners, average win 2.5R, average loss 1R | 0.60×2.5R − 0.40×1R = 1.10R. | A different distribution; neither example predicts a monthly return. |
| 40% winners, average win 2R, average loss 1R | 0.40×2R − 0.60×1R = 0.20R. | Costs of 0.25R per trade would turn this example negative. |
These simplified examples exclude costs and assume losses average exactly 1R. Monthly results also depend on trade count, changing size, overlapping positions and drawdowns. A target ratio alone does not establish a stable income stream.
Tools and Implementation
Testing Your Strategy
Use Quant, our coding agent, to turn one swing-trading idea into explicit code. A useful starting request is:
Create a daily long-only pullback strategy. Require close above the 200-day SMA. After close falls below the 20-day EMA, enter at the next open following the first completed close back above that EMA within five bars. Allow one position at a time. Set an initial stop two ATR(14) values below the actual entry, using ATR known at the signal close. Exit after ten bars if the stop has not filled. Make the lengths and holding period configurable.
Inspect the generated code and run it manually, following Making Strategies with Quant. Verify the five-bar expiry, entry timing, stop calculation and overlapping-signal behavior on a small sample before interpreting the report.
The native strategy viewer provides the backtest summary, performance views and trade log. Set commission, slippage, size and other simulation properties. Save the run with its symbol, timeframe and settings so comparisons can be reproduced.
A report showing 107 trades, an 82.24% win rate, $97.02 net profit and a 1.251 profit factor would still be insufficient to establish effectiveness without its strategy, data, dates and costs. Net profit divided by 107 would be about $0.907 per trade, but that arithmetic does not validate the test or explain a quoted drawdown percentage. Review the full trade log, losing periods and unseen samples.
Use standard price candles for execution testing and check data coverage. Synthetic candle prices and mismatched feeds can distort fills. Separate development data from evaluation periods and record every parameter variation tried.
Technical Analysis Tools
Vela and Library tools support native chart research. The standard RSI preview above can be opened on Vela; use the documented inputs rather than assuming all RSI variants share the same calculation.
Notifications and chart signals are not the same as broker fills. A strategy run over chart history produces simulated entries and exits. Review any execution workflow separately before using it with live capital.
Adapting to Market Conditions
| Context | Possible research focus | Control to define |
|---|---|---|
| Advancing market | Long pullbacks or breakouts under a trend filter. | What invalidates the trend and how much target space remains. |
| Declining market | Short setups where permitted, or waiting for a specified rebound. | Borrow availability, gap exposure and sizing; avoid automatically tightening every stop. |
| Sideways market | Rejections near predeclared range boundaries. | The break that ends the range assumption. |
| Volatility expansion | Whether the existing stop and holding rules remain suitable. | Maximum exposure and a predeclared pause or adjustment rule. |
Use information available at the time to classify the market. Relabeling losing periods after the fact as conditions the strategy “would have avoided” introduces hindsight. A triangle or flag can precede a breakout, so it should not automatically justify fading a range boundary.
The Ultimate Swing Trading Guide for Beginners
Getting Started
Choose one liquid market and one core strategy. Define the context, trigger, stop, target and holding limit, then verify the logic with a small chart sample. Use Quant to make the process reproducible and review costs, drawdown and failed setups before broadening it.
Liquid large-cap stocks can be one starting universe, but they still carry event risk. Swing trading works as a disciplined research and decision process; it does not become reliable merely by combining several indicators or adopting a fixed percentage risk rule.
Frequently Asked Questions
How long do swing traders hold positions?
Often several days or weeks, depending on the strategy. Define a maximum holding period and account for overnight, weekend and event risk.
Does RSI below 30 mean I should buy?
No. It indicates an oversold reading under the chosen settings, but strong declines can remain oversold. A trade requires separate context, trigger and exit rules.
Do tight Bollinger Bands predict an upward breakout?
No. Narrow bands describe reduced volatility. Direction requires additional price behavior and a defined trigger.
How do I size a share position?
Divide the chosen risk budget by the absolute entry-to-stop distance, round down and allow for costs, buying power and other exposure limits.
Does a 2R target guarantee profitability?
No. Results depend on realized wins and losses, win rate, costs and drawdowns. A target is an objective, not a guaranteed exit.
How can Quant help with swing trading?
Describe explicit strategy rules, inspect the generated code and run it manually. Verify timing and risk behavior, set simulation costs and review full results on unseen periods.
References
LuxAlgo Resources
- LuxAlgo Quant
- Making Strategies with Quant
- Native Strategy Backtests
- Relative Strength Index Library Tool
- Vela Data
External Resources
Read next