Top 5 Bullish Continuation Candlestick Patterns

A bullish continuation candlestick pattern is a short sequence of candles that marks a pause in an uptrend and its resumption. The LuxAlgo Library's Continuation entry describes what the pause has to look like to count: shallow in depth, with the prior swing low intact, and with participation thinning through the rest and expanding on the trendward break. The candlestick catalog compresses that behaviour into fixed templates of two to five candles. This guide covers five of them, drawn from the Japanese candlestick canon as documented in the Library, in StockCharts' ChartSchool dictionary and in Thomas Bulkowski's pattern statistics: the Rising Three Methods, the Mat Hold, the Upside Tasuki Gap, the Rising Window and the Bullish Three-Line Strike. For each you get the definition, an identification checklist, the invalidation level and what the published testing actually says, including the one case where testing contradicts the theory. It closes with how to detect, test and journal these patterns in Quant Charts.
What Makes a Continuation Pattern
Every pattern below assumes an existing uptrend. StockCharts' introduction to candlesticks cites Greg Morris on the point: for a pattern to qualify it needs a prior trend to act on, and because candlesticks are short-term signals, the last one to four weeks of price action is the usual context. The Library adds the grading. Depth: retracements that hold in the shallow third to half of the prior leg keep the trend's sponsorship story intact. Structure: the prior swing low surviving is the line between digestion and damage. Participation: volume draining through the pause and expanding on the break is the classic signature. The Library's Candlestick Patterns entry is also clear about the limits: the descriptive reading of candle shapes is uncontroversial, but the predictive claim is contested, formal studies reach conflicting conclusions, and experienced traders treat a pattern as one input needing confirmation from trend, location and volume.
1. Rising Three Methods
The Rising Three Methods is a five-candle pattern: a long white candle in an uptrend, three small-bodied candles that drift lower while staying inside the first candle's high-low range, and a fifth long white candle closing above the first candle's close. StockCharts' dictionary defines it the same way, with each small body fully contained in the first day's range and the fifth day closing at a new high. The mechanism is containment: the counter-trend attempt never escapes the range set by the initial impulse. It is candlestick language for what Western charting calls a flag.
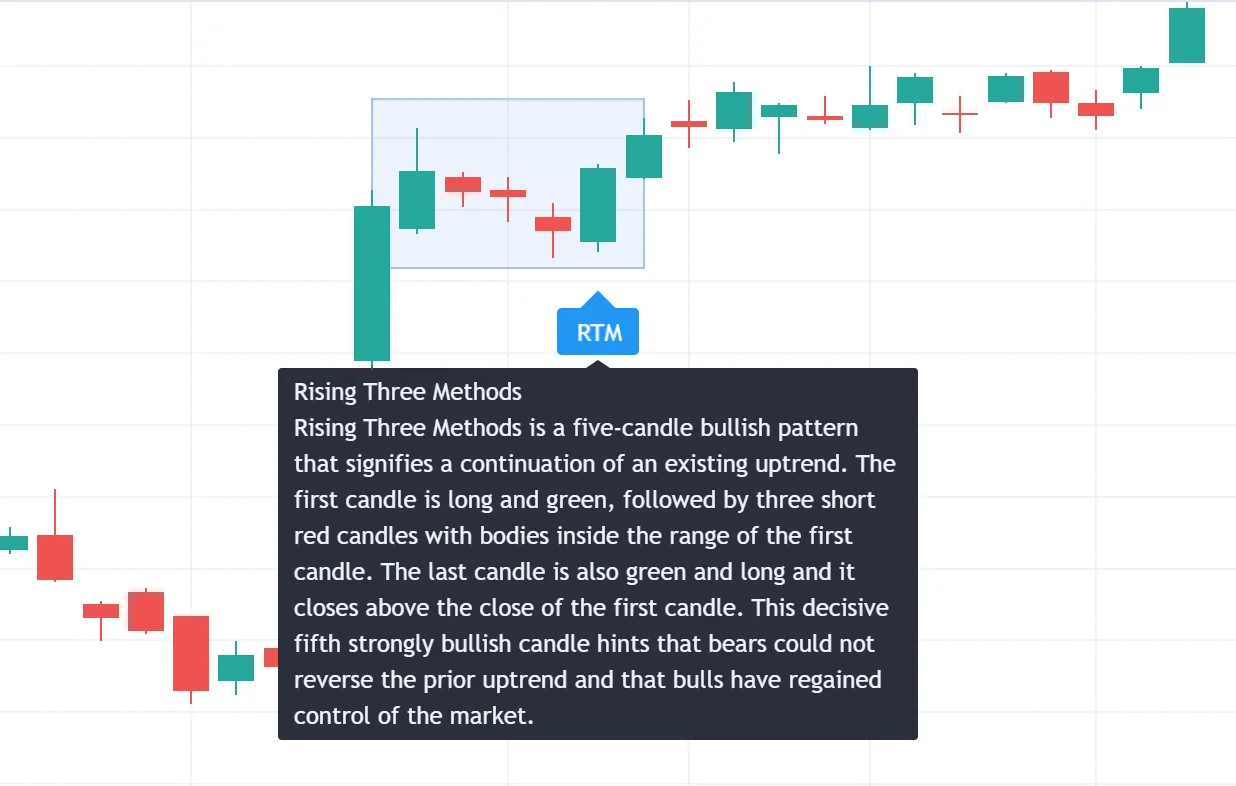
- Confirm the trend and the impulse: the first candle should be a long body in the trend direction, ideally one of the larger recent candles.
- Check containment: the small middle candles, classically three and in practice two to five, hold within the first candle's range while drifting against the trend.
- Prefer small bodies in the pause; large opposing bodies argue for a real fight rather than a rest.
- Require the resolution candle: a long white body closing above the first candle's close.
- Set invalidation at the low of the first candle's range; a close through it means containment failed.
Bulkowski's testing found the pattern acting as a bullish continuation 74 percent of the time, but from only 102 examples in more than 4.7 million candle lines, and he warns the statistics are likely to change with a sample that small. The strict form is rare; the Library notes that most practical implementations relax the count of middle candles and tolerate minor range violations.
2. Mat Hold
The Mat Hold is the Rising Three Methods' close cousin with two differences: the pause opens with a gap up into a small dark candle, and the small candles may dip somewhat below the first candle's close rather than being fully contained. The gap shows initial continuation strength before the rest, which is why the classical description grades it slightly stronger than the three methods. Bulkowski's identification guide has the small candles' bodies staying above the first day's low and the fifth candle closing above the high of the prior four.
- Establish an uptrend before the first long white candle.
- Check the gap: the second candle opens above the first candle's close as a small dark body.
- Watch the pause: candles two through four are small and drift lower, holding above the first candle's low.
- Require a long white fifth candle closing above the highs of the sequence.
- Invalidate on a close beneath the low of the pause.
In Bulkowski's data the Mat Hold continued the trend 78 percent of the time, but it is one of the rarest patterns in his catalog, ranked 93rd of 103 by frequency, and he expects the numbers to look worse with more samples. The Library makes the same point: strict mat holds are rare, so published statistics rest on small samples.
3. Upside Tasuki Gap
The Upside Tasuki Gap is a three-candle pattern in an uptrend: a white candle, a second white candle that gaps higher, then a black candle that opens inside the second body and closes into the gap without filling it. StockCharts' dictionary gives the same definition and stresses that the third day does not close the gap. The gap is the information: the third candle is the counterattack, and when it cannot fill the gap the pattern reads that as the gap being defended, so the trend is expected to resume. The unfilled portion behaves like the support a runaway gap conventionally provides.
- Confirm an advance; upside tasuki gaps belong in uptrends.
- Find a white candle followed by a second white candle with a gap between the two candles' shadows.
- Require a black third candle that opens within the second body and closes inside the gap.
- Void the pattern if the third candle, or a later one, closes the gap.
The Library records that Nison described it as a continuation signal while noting the classical Japanese sources treated it as minor, and that modern statistics find its continuation tendency modest. Bulkowski is blunter: continuation 57 percent of the time, which he calls near random, from 704 examples. Its overall performance rank of 5 out of 103 reflects the size of the moves that follow rather than their direction, so the honest use is as a gap-defence observation, not a directional bet.
4. Rising Window
A Rising Window is the Japanese name for an upward gap: yesterday's high sits below today's low, leaving a hole on the chart. Bulkowski's identification guide is two candles and one condition, the high of the first below the low of the second, in an upward trend. What the window means depends on which kind of gap it is, and the Library's gap entries supply the distinction: a breakaway gap leaves a congestion area, a runaway gap appears mid-trend, and an exhaustion gap arrives near a trend's end, while a common gap is filled shortly after it prints. Bulkowski's examples show the same classification at work, with one window breaking away from a congestion area, another marking exhaustion and a third filled within days.
- Confirm the trend, then find a bar whose low is above the prior bar's high.
- Classify the gap by where it sits in the trend and whether it followed a congestion area or a long run.
- Treat the gap's lower edge as the level to defend; the Library's gap fill entry covers how often and how quickly gaps close.
- Invalidate a continuation reading if the gap is filled and price closes below its lower edge.
Bulkowski found the rising window acting as a bullish continuation 75 percent of the time, with a minor low forming inside the gap before it closed in 20 percent of cases, and a median time to close the gap of 11 days against an average of 79, a skew that says most windows close quickly while a minority stay open for a very long time.
5. Bullish Three-Line Strike
The Bullish Three-Line Strike is included because it is the clearest example of theory and testing disagreeing. The template is four candles in an uptrend: three white candles, each closing higher, then a tall black candle that opens higher and closes below the open of the first white candle, erasing the three-day advance in a single session. Candlestick theory files it as a bullish continuation, on the argument that the strike candle flushes weak holders and the trend then resumes. Bulkowski's testing found the opposite: the pattern acted as a bearish reversal 65 percent of the time. His sample is tiny, with a frequency rank of 95 out of 103, and his headline performance figure rests on just two patterns, which he says not to expect to repeat.
- Confirm an uptrend and three consecutive white candles with progressively higher closes.
- Require a fourth, black candle that opens above the third close and closes below the first candle's open.
- Do not assume direction. Wait for the next candle to break out of the four-candle range and trade the break, with the stop beyond the opposite extreme.
The lesson generalises. A pattern's textbook label is a hypothesis; the breakout direction after the pattern completes is the evidence.
| Pattern | Candles | Defining feature | Invalidation | Bulkowski's tested continuation rate |
|---|---|---|---|---|
| Rising Three Methods | 5 | Small counter-trend candles contained in the first candle's range; fifth closes above the first close | Close below the first candle's low | 74% (102 examples) |
| Mat Hold | 5 | Gap up into a small dark candle, shallow drift above the first candle's low, fifth closes above the sequence high | Close below the pause low | 78% (very rare) |
| Upside Tasuki Gap | 3 | Gap between two white candles that a black third candle closes into but does not fill | Gap filled | 57% (704 examples) |
| Rising Window | 2 | First bar's high below the second bar's low | Gap filled and closed below | 75% |
| Bullish Three-Line Strike | 4 | Three rising white candles erased by one black candle | Break of the four-candle range | 35% (tested as reversal 65%) |
Reading the Statistics
Every figure in the table comes with the same caveats, stated by the source itself. Bulkowski's results are based on what he calls perfect trades, they count how often price broke out in the trend direction rather than whether a trade made money, and the rarer patterns rest on samples so small that he expects the numbers to change. The Library's judgement that formal studies of pattern profitability conflict is the right frame: none of these patterns is a standalone signal, and the ones with the highest continuation rates are also the ones seen least often. Trend context, the depth and structure of the pause, and volume behaviour decide more than the template does, and a pattern that fails at its invalidation level has done its job by telling you quickly.
Where Quant Charts Fits
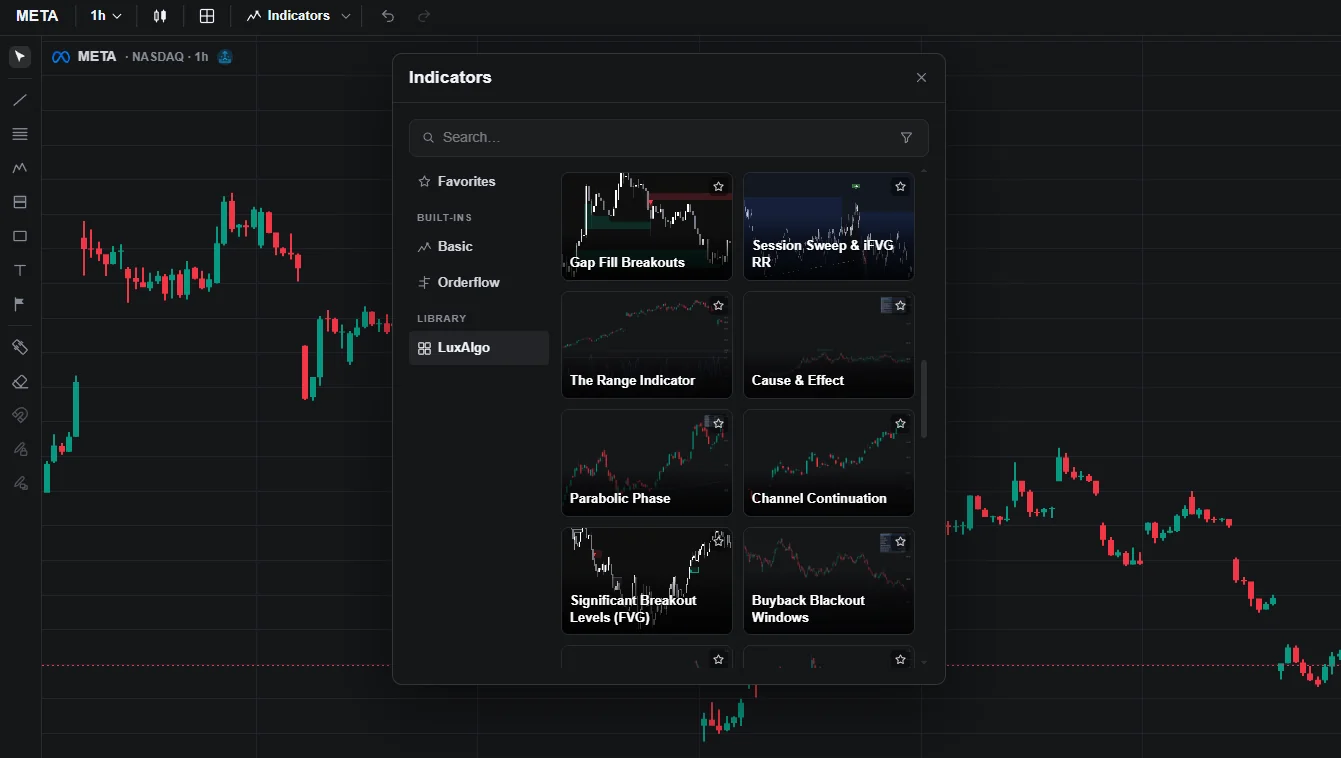
Detect the patterns natively. The LuxAlgo Library is built into the Quant Charts Indicators picker as its own section, and its candlestick entries include indicator implementations of the Rising and Falling Three Methods and the Upside and Downside Tasuki Gap that plot the completed patterns on the chart. Click Indicators, open LuxAlgo Library, and add them the same way you add RSI, or filter the Library by concept to see every candlestick study. On the Free plan you can add five indicators per chart plus one Quant script.
Describe a pattern to Quant. For a template the Library does not ship, such as the Mat Hold or the Three-Line Strike, describe the candle sequence to Quant, our coding agent, in plain language, or paste a screenshot of the pattern. Quant writes the Pine Script and plots it on the active chart; open Code to inspect the conditions, then click Run. Request one change per message, such as loosening the containment rule to allow two to five middle candles, and Quant rewrites it.
The video below shows how a watchlist is created in Quant Charts.
Test the pattern as a rule. Turn the detection into a strategy: enter on the resolution candle's close, stop at the invalidation level described above, exit at a fixed multiple of the pattern height or on a trend filter. Quant writes the strategy; the Backtest Summary reports net profit, trade count, win rate, max drawdown and profit factor, with commission and slippage set in the strategy's Properties. Expect the trade count to be small for the rarer templates, which is exactly Bulkowski's warning in another form, and re-run the same strategy on other symbols and timeframes from inside the viewer to see whether the result survives outside the market it was built on.
Journal the outcomes. Every plan includes the Journal, which turns broker fills or imported trades into round trips and reports win rate, profit factor and drawdown with a breakdown by hold time, day, time of day, symbol and side. Tag pattern trades by template and the Journal's statistics become your own continuation rates, on your own markets and costs, which is the only version of the table above that applies to you.
What the platform does not do. No LuxAlgo tool places orders. A detected pattern is a plotted condition, not a recommendation, and the platform cannot supply the trend context and judgement that the sources above say decide the outcome.
FAQs
What is a bullish continuation candlestick pattern?
A short sequence of candles marking a pause in an uptrend that resolves upward. The Library grades the pause by depth, structure and participation: a shallow retracement, an intact prior swing low, and volume thinning through the rest and expanding on the break.
Which bullish continuation pattern is most reliable?
In Bulkowski's testing the Mat Hold (78 percent) and Rising Window (75 percent) continued most often, with the Rising Three Methods at 74 percent, but the Mat Hold and Three Methods samples are tiny and the Upside Tasuki Gap is near random at 57 percent. Rarity and small samples make every rate provisional.
How do I identify a Rising Three Methods pattern?
A long white candle in an uptrend, then three small candles that drift lower while staying inside the first candle's high-low range, then a long white candle closing above the first candle's close. Invalidation is a close below the first candle's low.
How does the Mat Hold differ from the Rising Three Methods?
The Mat Hold opens its pause with a gap up into a small dark candle, and its small candles may dip somewhat below the first candle's close rather than being fully contained. The gap shows initial strength, which is why it is traditionally graded slightly stronger.
Is the Bullish Three-Line Strike really a continuation pattern?
Theory says yes, but Bulkowski's testing found it acting as a bearish reversal 65 percent of the time, from a very small sample. Treat the label as a hypothesis and trade the breakout direction from the four-candle range instead of assuming continuation.
Can Quant Charts detect these patterns?
The Library's Rising and Falling Three Methods and Tasuki Gap indicators are native in the Indicators picker, and Quant can write a detector for other templates from a description or screenshot, then turn it into a backtest with costs. The Journal records how your own pattern trades actually perform.
References
LuxAlgo Resources
- Rising/Falling Three Methods, Mat Hold and Upside/Downside Tasuki Gap concepts (LuxAlgo Library)
- Continuation, Candlestick Patterns, Breakaway Gap, Runaway Gap and Gap Fill concepts (LuxAlgo Library)
- Indicators, Making indicators with Quant, Making strategies with Quant and Journal Breakdown (LuxAlgo Docs)
External Resources
- Candlestick Pattern Dictionary and Introduction to Candlesticks (StockCharts ChartSchool)
- Thomas Bulkowski, Rising Three Methods, Mat Hold, Upside Tasuki Gap, Rising Window and Bullish Three-Line Strike (ThePatternSite.com)
This article is educational and is not trading advice. Pattern statistics quoted from published testing describe those samples and methods, several of which are small, and are not forecasts of your results.
Read next