Top Seven Reversal Candlestick Patterns Ranked
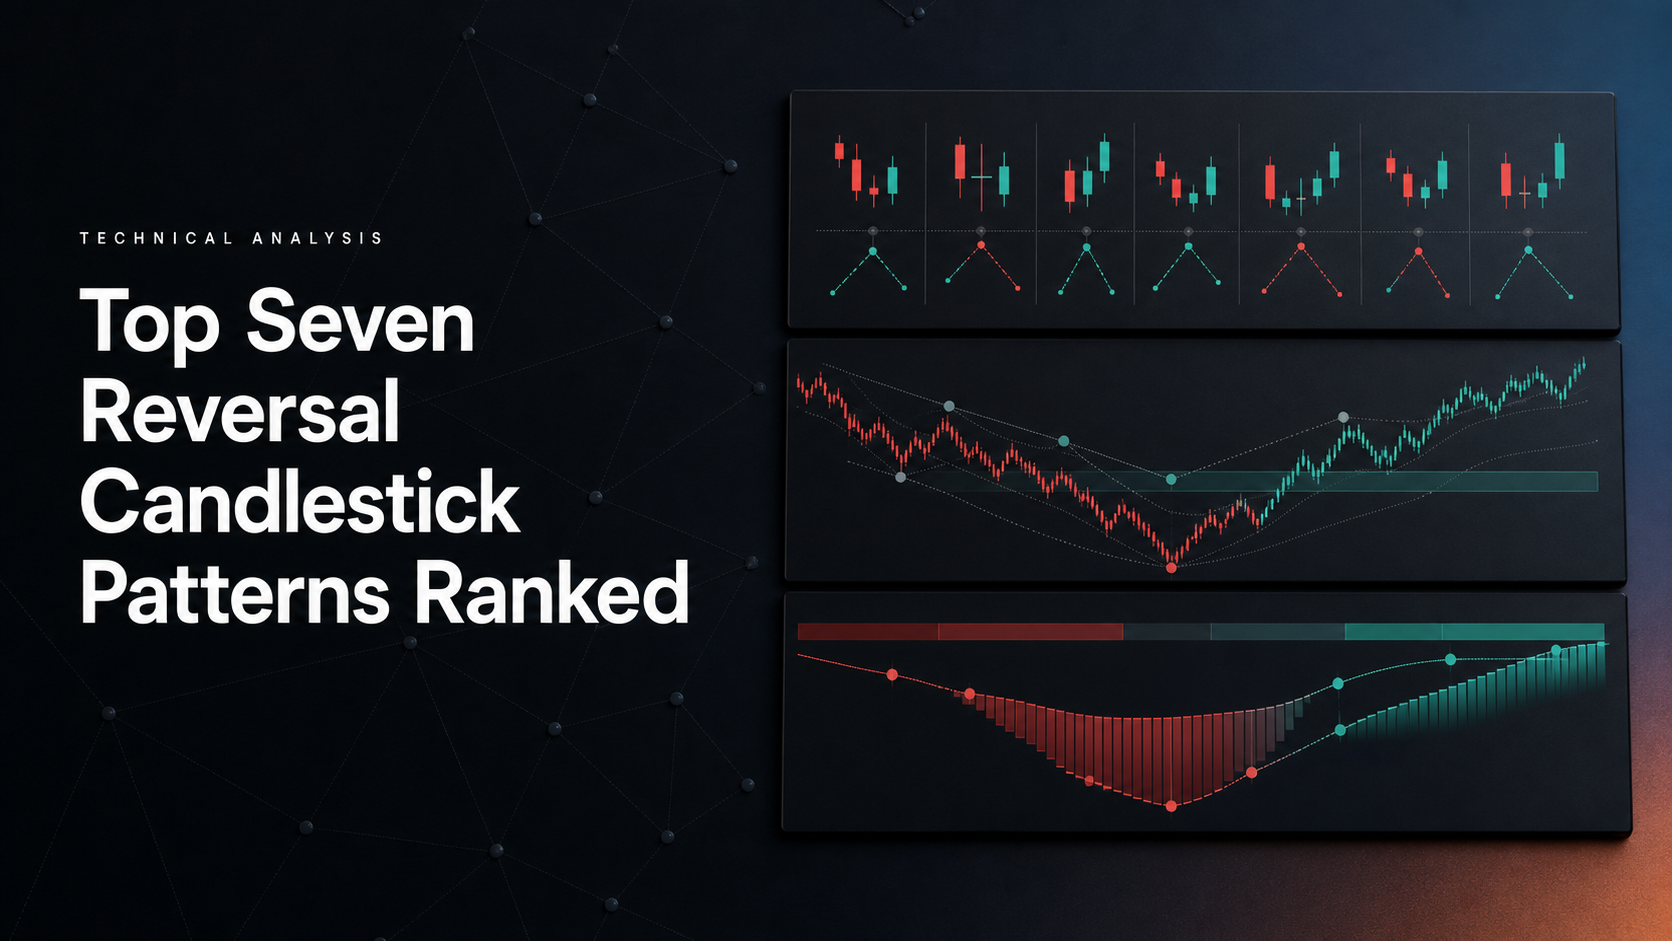
Hammer, Inverted Hammer, Bullish Engulfing, Bearish Engulfing, Morning Star, Evening Star and Shooting Star are seven useful reversal candlestick patterns to learn. They describe changes in price behavior after a decline or advance. None establishes a market turning point or a profitable trade by itself.
This guide ranks them in a practical learning order, starting with single-candle anatomy and then comparing related formations. It is not a measured ranking of trading returns. Use LuxAlgo’s charting and AI platform to inspect the context on Quant Charts and turn a promising pattern into explicit rules with Quant, our coding agent.
Quick Comparison
| Pattern | Candles | Reversal context | Key identifying feature |
|---|---|---|---|
| 1. Hammer | One | Potential bullish reversal after a decline | Small body near the high; long lower shadow |
| 2. Inverted Hammer | One | Potential bullish reversal after a decline | Small body near the low; long upper shadow |
| 3. Bullish Engulfing | Two | Potential bullish reversal after a decline | Second bullish real body covers the first bearish body |
| 4. Bearish Engulfing | Two | Potential bearish reversal after an advance | Second bearish real body covers the first bullish body |
| 5. Morning Star | Three | Potential bullish reversal after a decline | Small middle body followed by a strong bullish recovery |
| 6. Evening Star | Three | Potential bearish reversal after an advance | Small middle body followed by a strong bearish decline |
| 7. Shooting Star | One | Potential bearish reversal after an advance | Small body near the low; long upper shadow |
How These Patterns Were Ranked
The order is a study sequence, not evidence that the Hammer outperforms the other six. Ease of recognition, occurrence frequency and historical accuracy are different questions. A one-candle shape can be simple to spot but still fail repeatedly in a strong trend. A three-candle formation requires more conditions, but rarity does not establish greater reliability.
A defensible performance ranking needs the instrument, timeframe, sample dates, number of observations, exact pattern definition, entry, exit and costs. A statistic about price reversing after a pattern is not automatically a strategy’s win rate. Percentages from different studies cannot be placed in one league table without matching those definitions.
The StockCharts candlestick pattern dictionary provides the anatomy used below. Read each shape in its preceding trend and wait for completed candles. On a forming bar, the body and shadows can change substantially.
1. Hammer Pattern
A Hammer is a potential bullish reversal pattern after a decline. Its small real body sits near the top of the candle’s range, with a lower shadow commonly at least twice the body’s length and little or no upper shadow. The body can be bullish or bearish; a green candle is not mandatory.
The long lower shadow shows that price traded lower and recovered within that bar. It does not prove that buyers will control the next session. Near a previously defined support area, it supplies a specific rejection to investigate. The same general shape after an advance is a Hanging Man, so location changes the interpretation.
One candidate entry rule waits for the completed Hammer and a subsequent break above its high. An initial stop could sit below its low, with the distance and execution buffer defined in advance. Compare the next resistance with a proposed 2R or 3R target: a desired reward multiple does not create room for price to reach it.
2. Inverted Hammer Pattern
The Inverted Hammer also follows a decline, but its small body is near the bottom of the range. It has a long upper shadow, commonly at least twice the body’s length, and little or no lower shadow. Price tested higher levels but closed back near the low, making subsequent bullish follow-through particularly relevant to the reversal hypothesis.
Do not confuse it with the Shooting Star, which has similar anatomy after an advance. Nor should an Inverted Hammer be called a confirmed bottom simply because it appears near support. Specify the preceding decline and confirmation rule so the classification can be reproduced.
A possible long setup requires a later move above the completed candle’s high, with invalidation below its low. That entry can be some distance from the stop; calculate position size before taking it. If the next resistance leaves insufficient potential reward, the pattern can be valid while the trade is unattractive.
3. Bullish Engulfing Pattern
A Bullish Engulfing forms after a decline when a bearish real body is followed by a bullish real body that covers it. The comparison is between the open and close of each candle. The second candle does not have to engulf the first candle’s entire high-to-low range.
Write down how you handle equal opens or closes, very small first bodies and gaps. These details affect how many patterns a detector finds. A fixed claim that the setup becomes reliable after four bearish candles is a separate filter that needs testing, not part of every definition.
A candidate entry is above the second candle’s high after completion. For a stop based on the whole formation, use the lower low of both candles, not automatically the second candle’s low. Identify the next resistance and compare reward with that actual risk distance.
4. Bearish Engulfing Pattern
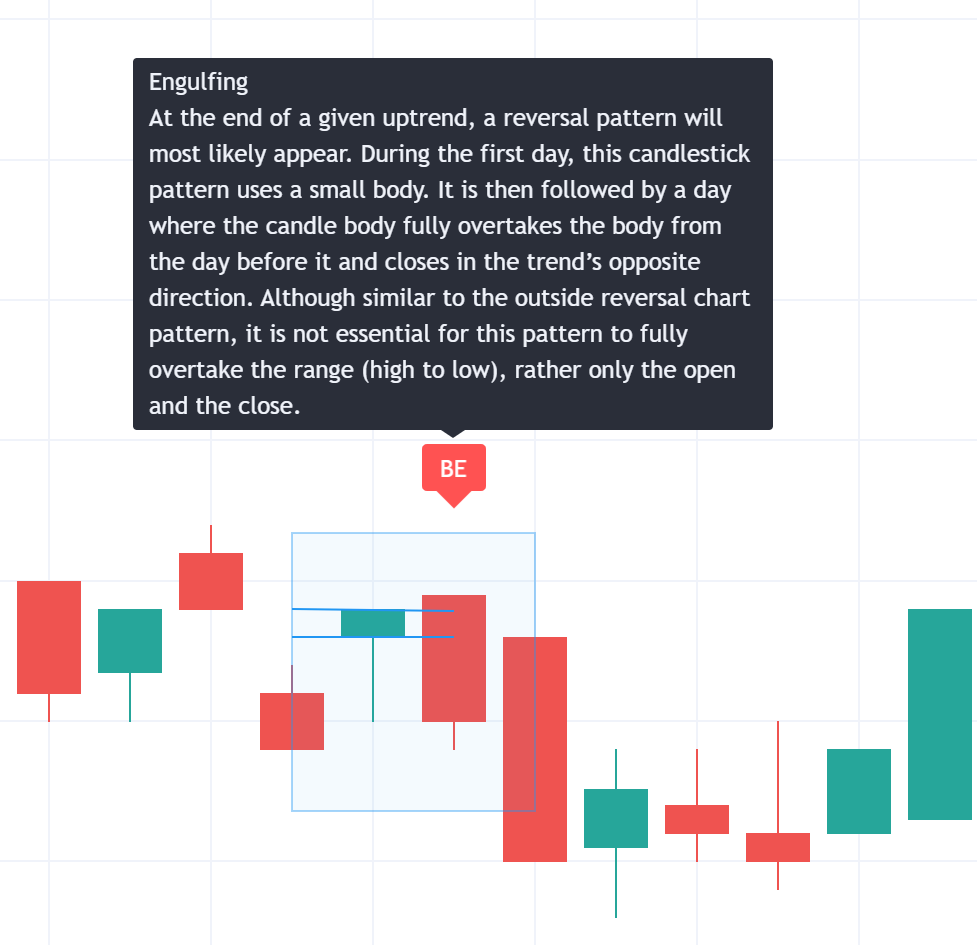
A Bearish Engulfing reverses the body relationship: after an advance, a larger bearish real body covers the preceding bullish body. It shows a change in that two-bar price sequence, not proof of a lasting shift in ownership or sentiment.
Resistance, a failed move above a prior high and volume can provide context. They must be defined before the outcome is known. A large red candle can also be a temporary pullback in a continuing uptrend.
One short-entry model waits for a break below the completed second candle’s low. A stop above the whole pattern uses the higher high of the two candles. That is different from placing it above only the engulfing candle, because the first candle’s wick may extend farther. Short selling also involves product access, borrowing costs where applicable and potentially substantial losses.
5. Morning Star Pattern
A Morning Star is a three-candle potential bullish reversal following a decline. The first candle has a relatively large bearish body, the second a small body, and the third a strong bullish body closing above the midpoint of the first candle’s real body.
The classic formation includes separation around the small middle body. Continuous markets may show fewer session gaps, so a gap-relaxed detector is a variation that should be labeled and tested consistently. A doji in the middle creates a related Morning Doji Star variation; a doji is not required for every Morning Star.
Wait until the third candle has closed before evaluating its recovery. A possible entry above its high, with a stop below the lowest low of all three candles, can produce a wide risk distance. Use the next resistance to assess whether the setup offers adequate room rather than assuming three candles mean higher accuracy.
6. Evening Star Pattern
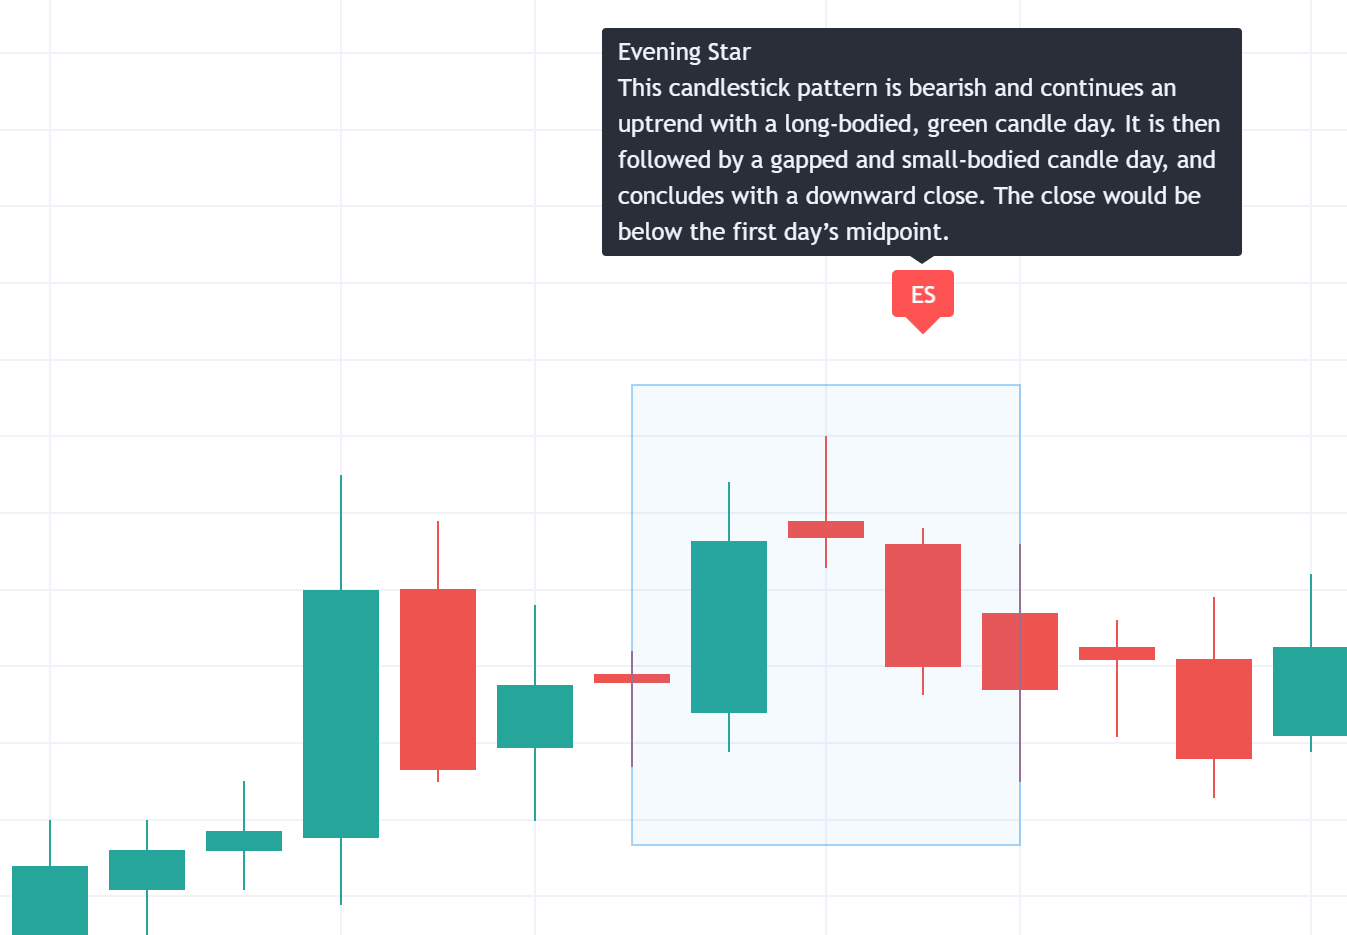
An Evening Star is the bearish counterpart after an advance: a large bullish body, a small middle body, and a bearish third candle that closes below the midpoint of the first real body. The middle candle represents a pause, while the third supplies the downward follow-through needed to complete the formation.
Classic gap conditions and any relaxed version should be distinguished just as with the Morning Star. Neither a daily timeframe nor unusually high third-candle volume supplies a universal success rate. A pattern against a strong higher-timeframe advance can still fail.
A possible short entry is below the third candle’s low after completion, with an initial stop above the highest high of the three-candle formation. Prior support supplies a potential target. If confirmation arrives only after a large decline, assess the remaining reward rather than chasing the completed pattern.
7. Shooting Star Pattern
A Shooting Star follows an advance and has a small body near the low, a long upper shadow commonly at least twice the body’s length, and little or no lower shadow. The body can be either color. A large bearish body with a short upper wick is not the same formation.
The shadow records an intrabar rejection of higher prices. It does not identify the final peak of the trend in real time. A subsequent bearish break can be part of a confirmation rule, while continued movement above the high challenges the reversal interpretation.
A possible short setup waits for a break below the completed candle’s low, places initial invalidation above its high and evaluates prior support as a target. As with the Inverted Hammer, the long wick affects the stop distance and therefore position size.
Choose Patterns by Context and Testable Rules
Day traders can study one- and two-candle setups on intraday charts, while swing or position traders may use daily or higher intervals. These are workflow choices, not evidence that each trading style has one best formation. Measure occurrence frequency on your own instrument and timeframe.
Mark support, resistance and the preceding trend before looking for a pattern. Volume relative to a defined baseline can describe participation, but a spike can accompany either reversal or continuation. Be explicit about whether your feed supplies exchange volume or tick volume.
RSI, MACD and moving averages can describe momentum and trend context. They do not independently verify that a reversal will occur, and overlapping momentum indicators may repeat the same information. Compare the pattern-only rule with each proposed filter after costs. For multiple timeframes, use only higher-timeframe information available at the decision time.
Using LuxAlgo to Find and Study These Patterns
Review Price on Quant Charts
Use Quant Charts to inspect the actual candles, switch intervals and mark the pattern’s extremes. Keep ordinary price candles for these definitions; transformed displays such as Heikin Ashi use synthetic values and produce different shapes.
Reversal Candlestick Structure
The Reversal Candlestick Structure Library page provides access to its native chart workflow and separate TradingView version. The study recognizes 16 named formations, including all seven covered here, and uses a stochastic filter to flag potential reversals. Its list also includes Rising and Falling Three Methods, conventionally continuation patterns; the list is not 16 identical reversal signals.
Settings include Trend Length for trend sensitivity, Threshold for filtering near trend extremes, Warm-up Length for trend establishment, individual pattern toggles and display options. Labels, optional candle coloring and a dashboard help inspect detections. These controls change the sample; they do not guarantee fewer losing trades.
The dashboard’s Reversal % is the share of pattern detections flagged as potential reversals, not a trading strategy’s win rate. Hovering can show the total occurrence count. A trade result requires entries, exits, costs and execution assumptions that the detection percentage does not supply.
Do not treat this indicator as an automatic support/resistance, stop-management or 8–9 candle exhaustion system. LuxAlgo’s Price Action Concepts is a separate TradingView toolkit for structure and related price-action analysis. Check the exact product, platform and current plan access before combining tools. Alerts likewise need their specific supported conditions checked; a notification does not manage a trade.
Test Pattern Rules with Quant
Use Quant, our coding agent, to help express a pattern as a strategy. For example, specify the body-engulfing definition, preceding-decline filter, completed-bar trigger, next-bar entry, two-candle stop, target and expiry. Keep equality and gap rules explicit.
Follow Making Strategies with Quant: inspect the generated code and click Run yourself. Review the trades and settings using the native backtest guide. Confirm fees, slippage, order timing and what happens when a bar touches both stop and target. Working code is not proof of correct logic or profitable performance.
Compare the seven patterns under matching assumptions, retain losing samples and use an untouched test period. The legacy Backtesting Assistant is a separate workflow. Neither it nor Quant turns an indicator’s detection statistics into verified future returns.
Trading Tips and Risk Management
| Pattern group | Example initial invalidation | Important distinction |
|---|---|---|
| Hammer / Inverted Hammer | Below the candle low | Long shadows can require smaller size |
| Bullish / Bearish Engulfing | Below / above the whole two-candle range | The first wick can extend beyond the second |
| Morning / Evening Star | Outside the entire three-candle range | Confirmation may leave a wide stop |
| Shooting Star | Above the candle high | A red body is not required |
Position Sizing: A Hypothetical TSLA Example
Suppose a $25,000 account allocates an illustrative 2% risk budget, or $500. This is an arithmetic example, not a recommended risk limit or a current TSLA trade. With an assumed entry at $225 and stop at $195, the planned risk is $30 per share.
- Whole shares: floor($500 ÷ $30) = 16.
- Position value: 16 × $225 = $3,600.
- Planned loss at the assumed stop fill: 16 × $30 = $480, or 1.92% of the account before costs.
- A hypothetical $285 target offers $60 per share, or 2R relative to the $30 initial risk.
A gap that produces an exit at $185 instead of $195 creates a $640 loss before costs: 16 × ($225 − $185). Stops do not guarantee the assumed fill. Account for spread, fees and liquidity, and check whether the position value is affordable within your account constraints.
As volatility changes, size from the chosen invalidation distance instead of automatically cutting every position by 25–50%. If using a trailing stop, define when and how it tightens; it cannot guarantee locked-in gains through a gap. Set a risk budget appropriate to the account and aggregate exposure.
Keep a Pattern Trading Journal
Record the instrument, interval, pattern, preceding trend, entry condition, stop, target, costs and reason for any skipped trade. Save the chart as it appeared at the decision, not only after a successful reversal. Track average wins and losses, drawdown and trade count alongside win rate. This makes it possible to distinguish a visually appealing pattern from a repeatable trading process.
Putting the Patterns in Perspective
The StockCharts bullish reversal guide illustrates two Bullish Engulfings in Sun Microsystems in January 2000, followed by advances. The examples show how a formation can align with a recovery and prior support. Two selected historical charts do not establish profitability or a universal success rate.
Start with accurate candle anatomy, add a defined market context and calculate the risk before entry. Quant Charts supports the visual review; Quant helps translate the hypothesis into code you can inspect and test. Keep pattern recognition, trade execution and measured results separate throughout that process.
FAQs
How can I use volume analysis with reversal candlestick patterns?
Compare volume with a predefined baseline and assess the surrounding price action. Higher volume can accompany reversal or continuation, so it is context rather than proof. Test whether the volume filter improves your specific strategy after costs.
What is the difference between a Hammer and an Inverted Hammer?
A Hammer has a long lower shadow and a small body near the high. An Inverted Hammer has a long upper shadow and a small body near the low. Both are potential bullish reversal formations after a decline, and neither guarantees the next move.
Why use other indicators with reversal candlesticks?
RSI, MACD and moving averages can supply measurable momentum or trend filters. They do not confirm future outcomes. Compare each filter with the unfiltered pattern and avoid assuming that more overlapping indicators add independent evidence.
Does an engulfing candle have to cover both wicks?
No. The standard engulfing definition compares real bodies. The second body covers the first body, while the first candle can still have a higher high or lower low. A stop outside the whole pattern must consider both candles.
Which reversal candlestick pattern has the highest win rate?
There is no universal ranking without matching market data, pattern definitions, entry and exit rules, costs and sample periods. The order in this guide is a learning sequence, not a measured profitability ranking.
Is Reversal % in the LuxAlgo indicator a trading win rate?
No. It describes the share of pattern detections flagged as potential reversals by the indicator. A trading win rate requires a strategy with defined entries, exits and execution assumptions.
References
LuxAlgo Resources
- Quant Charts
- LuxAlgo Quant
- Making Strategies with Quant
- Native Backtest Guide
- Reversal Candlestick Structure
- Price Action Concepts
- Backtesting Assistant
- LuxAlgo Pricing
External Resources
Read next