Concept
Hanging Man
Hanging Man is a Chart & Candlestick Patterns concept. The Library holds 1 implementation, a working definition you can pull into Quant.
Top Hanging Man indicator
The top custom implementation, built on the original standard Hanging Man formula.
1 total
This Hanging Man implementation is strategy-ready: open it in Quant, set your rules, and it backtests automatically.
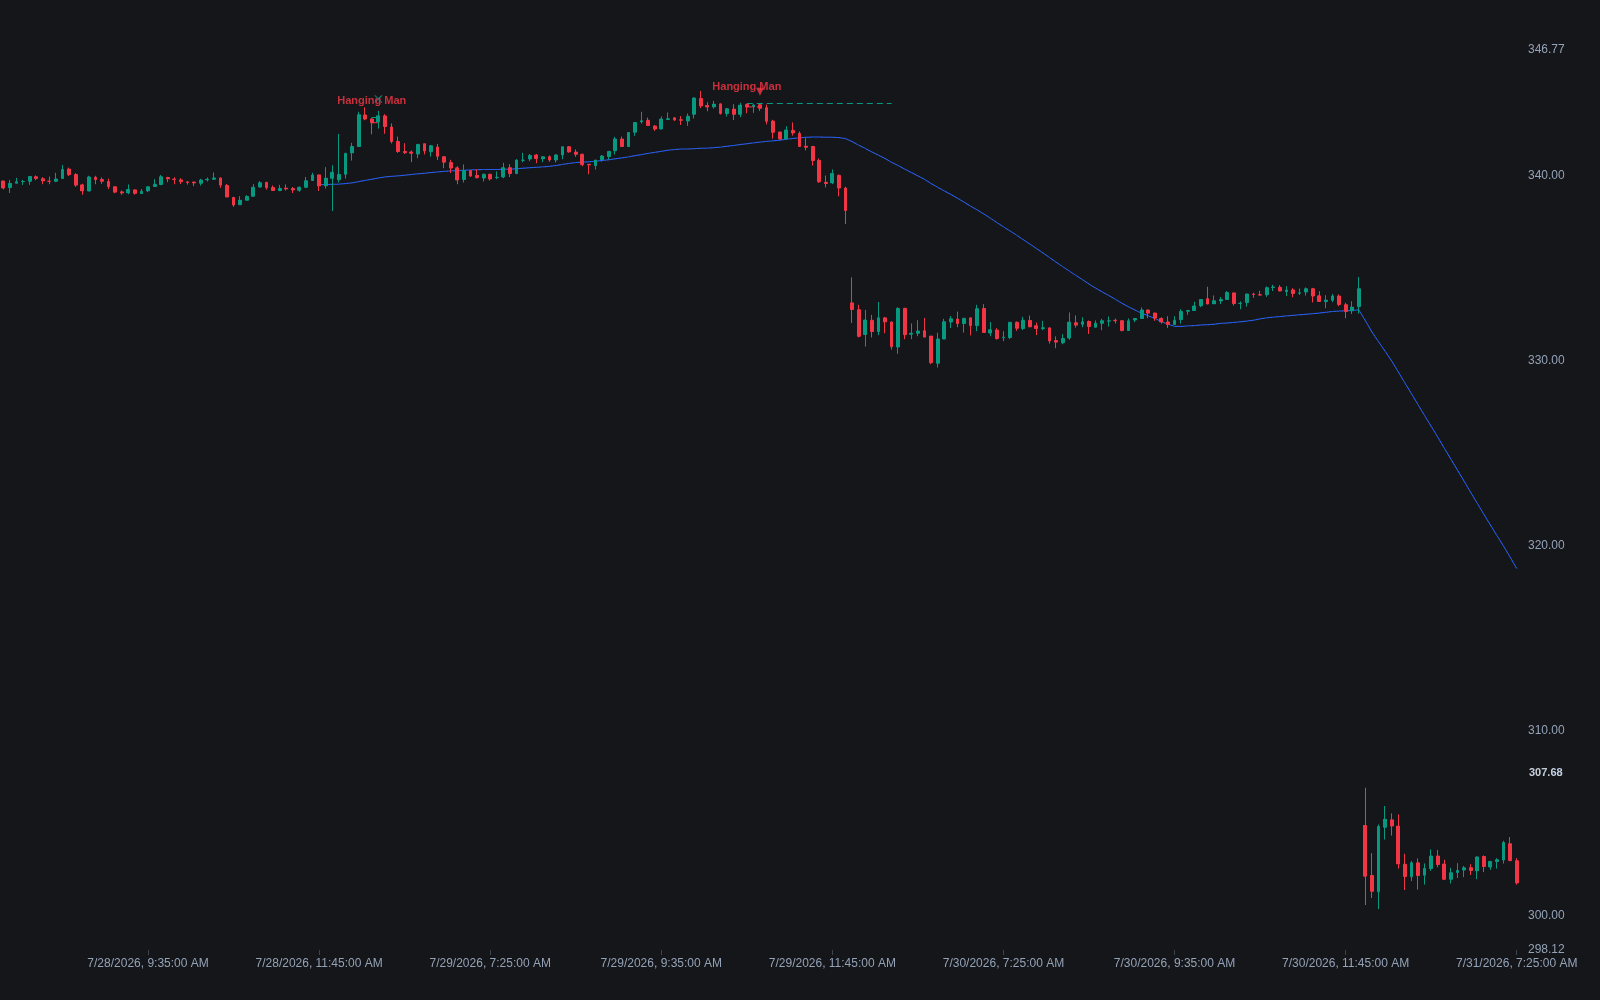
What is a hanging man?
The hanging man is a single-candle bearish alert that appears after an advance: a small real body near the top of the range, a long lower shadow at least about twice the body's height, and little or no upper shadow. The shape is identical to the hammer; the label changes with the location. At the bottom of a decline the candle is a hammer and reads bullish, while at the top of an advance it is a hanging man and is watched as a warning.
The logic is less intuitive than most reversal candles and worth stating plainly. During the session, price broke sharply lower before recovering, which after a sustained rally is the first evidence that meaningful selling can appear at these levels. Buyers rescued the close, but the long lower shadow proves the market traded heavily lower intraday. In the classical treatment, popularized in the West through Steve Nison's work on Japanese candlesticks, the hanging man is explicitly a candle that requires bearish confirmation, typically a following close below the hanging man's body, because on its own the recovered close is not bearish at all.
Traders care about it as an early crack in an uptrend: it does not call the top so much as flag that the character of trade has changed, with intraday liquidation appearing where there had been none. Within the broader candlestick catalog it is among the weaker signals unconfirmed and among the more useful ones once the next session validates it.
How to identify a hanging man on a chart
Shape is necessary but not sufficient; the trend and confirmation requirements carry most of the weight.
- 1Require a preceding advance; without an uptrend to reverse, the candle is just a lower-shadow bar.
- 2Check the shape: a small body near the top of the range, a lower shadow at least about twice the body, and minimal upper shadow. Body color matters little, though a down-close is considered marginally more bearish.
- 3Prefer prints at resistance, at measured targets, or after acceleration, where a supply response has context.
- 4Demand confirmation: the classical rule is a following close below the hanging man's real body before the signal is considered active.
- 5Use the candle's high as the invalidation reference once positioned, since new highs above it restore the uptrend reading.
How traders use it
- As a warning for trend followers: longs seeing a hanging man after an extended run often tighten stops or take partial profits rather than exit outright, treating it as a change-of-character flag.
- As a confirmed reversal entry: shorter-term traders enter on the confirming down-close below the body, with stops above the pattern high, accepting that the entry is a session late by design.
- With volume context: a hanging man on elevated volume suggests real distribution met the intraday break, strengthening the warning; a quiet one is easier to dismiss.
- With honest limits: unconfirmed hanging men fail frequently, and in strong trends even confirmed ones often produce only shallow pullbacks. The candle supplies an alert and a risk framework, not a prediction.
Hanging man vs look-alike candles
Hammer: Identical shape, opposite context: the hammer prints after a decline and reads as rejection of lower prices, while the hanging man prints after an advance and reads as the first appearance of serious intraday selling.
Shooting star: Both are bearish alerts at highs, but the shooting star carries its long shadow above the body, recording a failed push higher; the hanging man's shadow is below, recording an intraday break that was bought back.
Pin bar: The pin bar is the bar-chart generalization of long-shadow rejection candles and is usually traded in the direction opposite its tail; the hanging man is the specific case where a lower tail after an uptrend is read bearishly, against the tail's naive direction.
Concept family
Chart & Candlestick Patterns
84 concepts mapped · 84 in the Library
Hanging Man FAQ
Turn Hanging Man into a trading strategy.
Take the implementation from this page into Quant, then build on it, backtest it on real data, and keep refining it in conversation.