Concept
Fib Time Tools
Fib Time Tools, also known as trend-based fib time, time zones, are Support/Resistance & Levels concepts. The Library holds 1 implementation, a working definition you can pull into Quant.
Top Fib Time Tools indicator
The top custom implementation, built on the original standard Fib Time Tools formula.
1 total
This Fib Time Tools implementation is strategy-ready: open it in Quant, set your rules, and it backtests automatically.
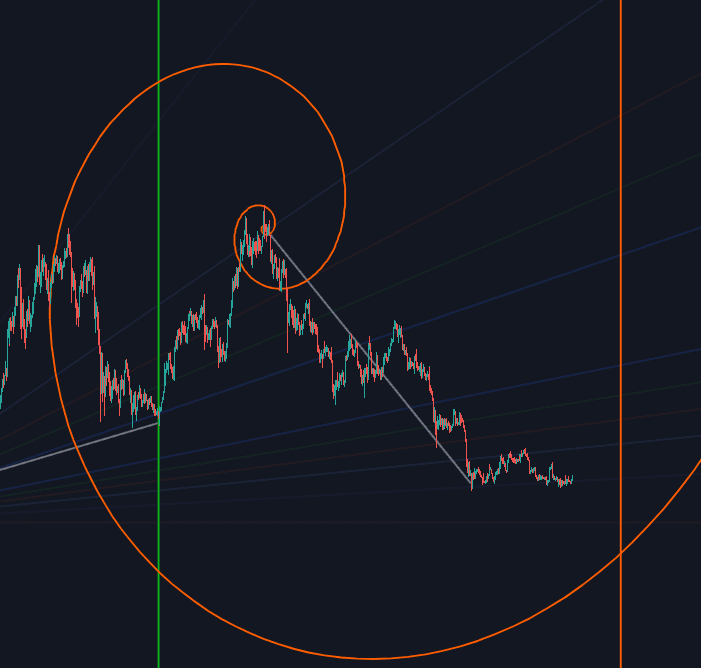
What are Fib Time Tools?
Fib time tools apply Fibonacci analysis to the horizontal axis of the chart instead of the vertical one. Where a Fibonacci retracement asks how far a move may travel in price, time tools ask how long a move may take. The two common forms are Fibonacci time zones, vertical lines plotted at Fibonacci-sequence intervals (1, 2, 3, 5, 8, 13, 21 bars) from a chosen anchor, and trend-based Fib time, which measures the duration of a reference swing and projects ratios of that duration (0.382, 0.618, 1, 1.618) forward to mark dates where a later move might complete.
Time analysis is the older obsession: Gann's work made when as important as where, Elliott related wave durations to Fibonacci counts, and the platform tools inherit both traditions in simplified form. The sequence-count version descends from Elliott-era bar counting; the ratio version applies the projection logic of price tools to duration, treating a swing's length in bars as transferable the way its length in points is.
Both tools produce windows to watch rather than predictions. Everything depends on the anchor: shift the starting bar and every line moves. Practitioners commonly ignore the first few time-zone lines, which crowd too tightly to mean anything, and treat the later ones as calendar checkpoints in the same spirit as fixed time cycles: moments to look for a turn, valid only if price behavior confirms one.
The craft is discipline about weak evidence. Time tools have thinner empirical standing than price tools, so serious use keeps them strictly secondary: anchors on major, unambiguous pivots; early lines discarded; windows treated as attention schedules rather than signals; and action reserved for the coincidences, a projected time window arriving while price simultaneously tests a meaningful support or resistance level, where the two axes agree that something is due to be decided.
How to use Fib time tools
The tools schedule attention; price behavior inside the windows does the deciding.
- 1Anchor on a major pivot: a structural swing high or low whose significance is not in dispute, since every line inherits the anchor's quality.
- 2For time zones, plot the sequence intervals forward and discard the first several lines, which sit too close together to mean anything.
- 3For trend-based time, measure a reference swing's duration in bars and project its ratios (0.382, 0.618, 1.0, 1.618) from the chosen point.
- 4Treat each projected date as a watch window of a few bars, not a single deadline bar.
- 5Act only on agreement: a time window plus a price test of a real level is the tradeable coincidence; a time line crossing empty space is nothing.
- 6Re-anchor when structure replaces the old pivot, and let obsolete time studies go rather than layering them.
How it's calculated
Vertical lines placed at Fibonacci bar counts or at Fibonacci multiples of a reference wave's duration, projecting when a reaction may be due.
Everything is counted in bars, so the same anchors mark different calendar dates on different timeframes and around session gaps.
The first few zones sit close together and are usually disregarded; spacing between later zones grows by a factor approaching 1.618.
Some tools anchor time zones with two points and space the lines at Fibonacci multiples of that base interval instead of single bars.
How traders use it
- As reversal watch-windows: when price approaches a projected time line while also testing a meaningful price level, traders watch for turning behavior, treating the overlap of time and price as stronger evidence than either alone.
- To estimate correction length: trend-based Fib time projects ratios of the prior swing's duration, flagging the dates where a pullback has consumed 0.618 or 1.0 of the time the impulse took, with confirmation still required there.
- As a confluence input: a time window that lands on a Fibonacci clusters in price gives a specific date-and-level combination to plan scenarios around.
- Alongside calendar structure: projected windows are cross-checked against fixed calendar references such as period opens and boundary sessions, since a 'Fibonacci date' that coincides with a quarter turn owes its activity to the calendar as much as the count.
- For patience management: swing traders use duration ratios to calibrate expectations, a correction that has consumed a full 1.0 of its impulse's time without breaking structure argues the trend's rhythm has slowed, informing sizing and re-entry pacing rather than triggering anything.
Fib time tools vs neighboring references
Fib Retracement: The retracement grades a move's depth in price; time tools grade its duration in bars. They share the ratio family and the anchor-dependence, and the strongest readings come where the two axes point at the same moment together.
Fib Geometry Tools: Geometry tools (fans, arcs) blend price and time into slopes and curves, committing to a specific rate of travel. Time tools keep the axes separate, projecting dates without claiming what price will do on the way to them.
Period Opens: Period opens are fixed calendar anchors everyone shares; Fib time windows are derived from chosen swings and differ per analyst. When a projected window lands on a period boundary, expect the calendar, not the count, to be doing most of the work.
Concept family
Support/Resistance & Levels
38 concepts mapped · 38 in the Library
Fib Time Tools FAQ
Turn Fib Time Tools into a trading strategy.
Take the implementation from this page into Quant, then build on it, backtest it on real data, and keep refining it in conversation.