Traditional Chart Patterns in Technical Analysis
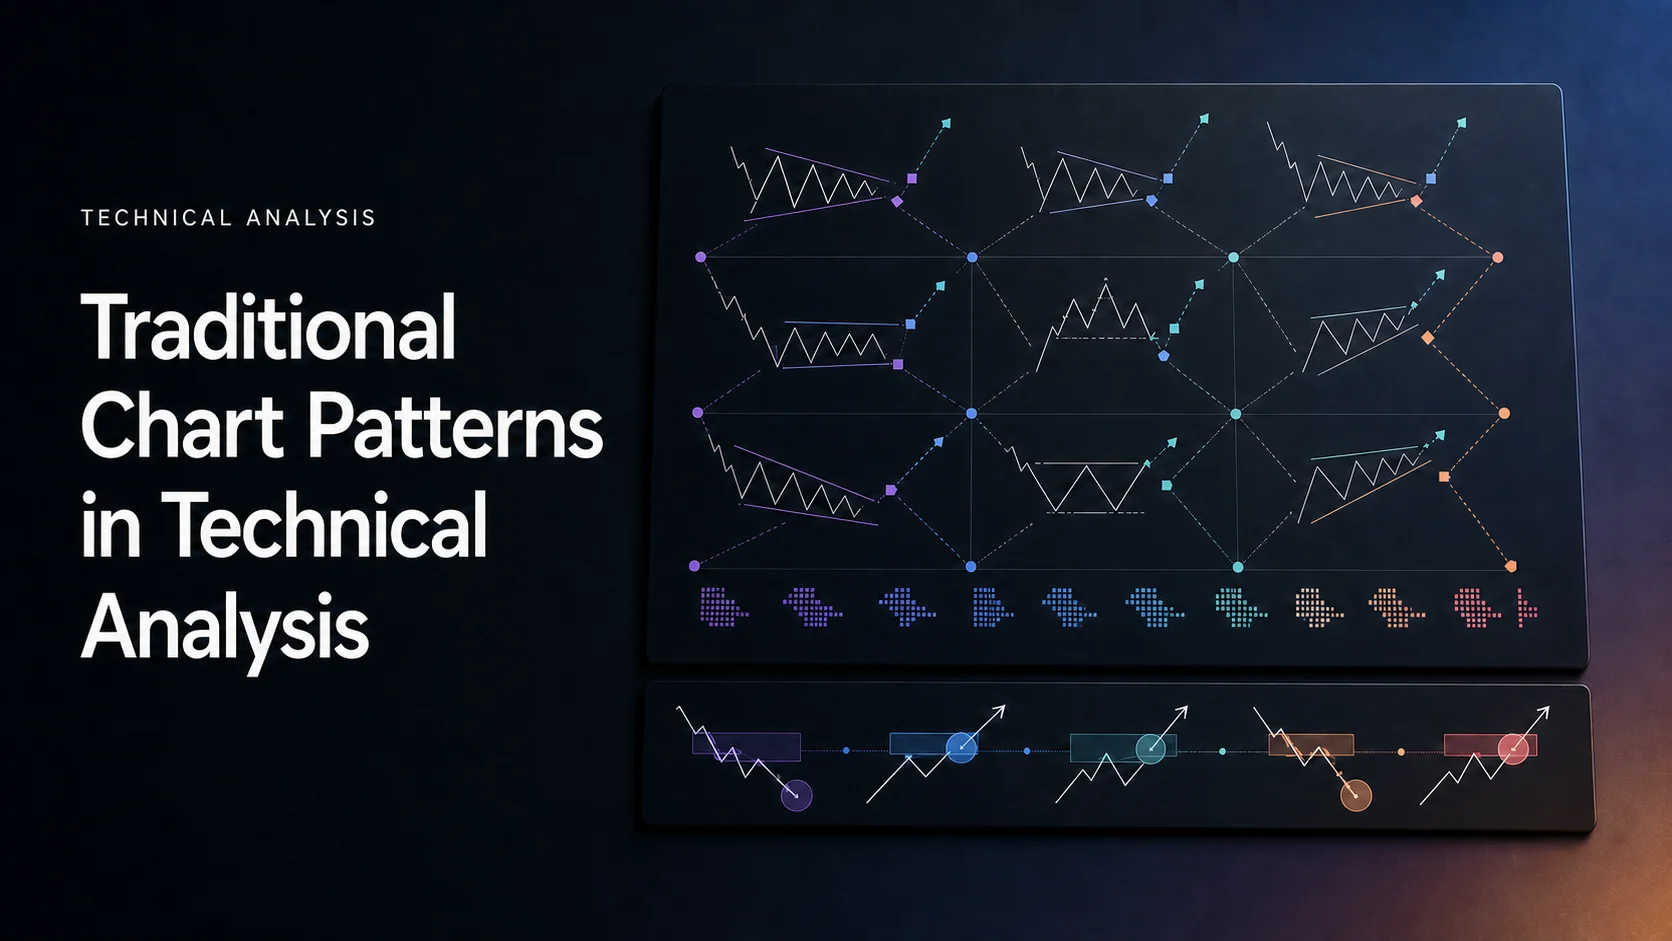
Traditional chart patterns describe recurring arrangements of price highs, lows, and consolidation boundaries. Head and shoulders, double tops and bottoms, triangles, and flags help traders organize a hypothesis about a reversal or continuation. A recognizable shape is a starting point: define the breakout, the conditions that reject the trade, and the risk before acting.
Start in LuxAlgo charts by marking the relevant swings and comparing time frames. If you want to test a repeatable version of the idea, ask Quant to translate explicit rules into code, inspect the result, and run it manually. Pattern recognition and a profitable trading strategy are different problems.
- Identify: establish the preceding trend and draw support, resistance, or converging boundaries.
- Confirm: specify whether a completed candle must close beyond the boundary and how volume will be evaluated.
- Manage: calculate position size from the planned loss, including realistic costs and execution uncertainty.
- Review: log failed breakouts as well as successful examples; a projected target is not a promised outcome.
Chart Pattern Basics
Understanding Price Movements
Patterns connect a sequence of swing highs and lows. A support area marks prices where declines have previously stalled; resistance marks an area where advances have stalled. Trendlines connect relevant swings, while horizontal levels identify repeated tests of a similar price. Treat these as zones with a stated tolerance, rather than assuming every touch must match exactly.
Context matters. A double top is a potential reversal after an advance; two similar highs in an otherwise directionless market do not automatically establish that setup. A flag needs a preceding directional move, often called the flagpole. Without that move, a small channel may simply be a trading range.
The Role of Market Psychology
A repeated rejection of a price can be interpreted as changing buying or selling pressure, but a chart cannot prove participants’ motives. Fear, greed, profit-taking, and new information may all influence prices. Describe what is observable—such as a lower high followed by a support break—before assigning a psychological explanation.
Avoid judging a pattern only after the outcome is visible. Record when each swing became recognizable. A pivot defined using candles on both sides is confirmed only after the required later candles arrive; a historical marker placed on the pivot candle was not necessarily available at that time.
Ultimate Chart Patterns Trading Course
This Wysetrade tutorial provides a visual introduction to traditional chart patterns. Use it to compare shapes and terminology, then apply the explicit confirmation and risk rules below. Historical examples and the video’s promotional title do not establish a success rate for your market or settings.
Main Chart Pattern Types
Trend Reversal Patterns
Head and shoulders: after an advance, a higher central peak sits between two lower peaks. Connect the intervening reaction lows to form the neckline, which may slope. A defined break below that neckline completes the bearish setup under a breakout-based method; the right shoulder alone is insufficient. Inverse head and shoulders reverses the structure after a decline. See the bearish chart pattern guide for neckline and target examples.
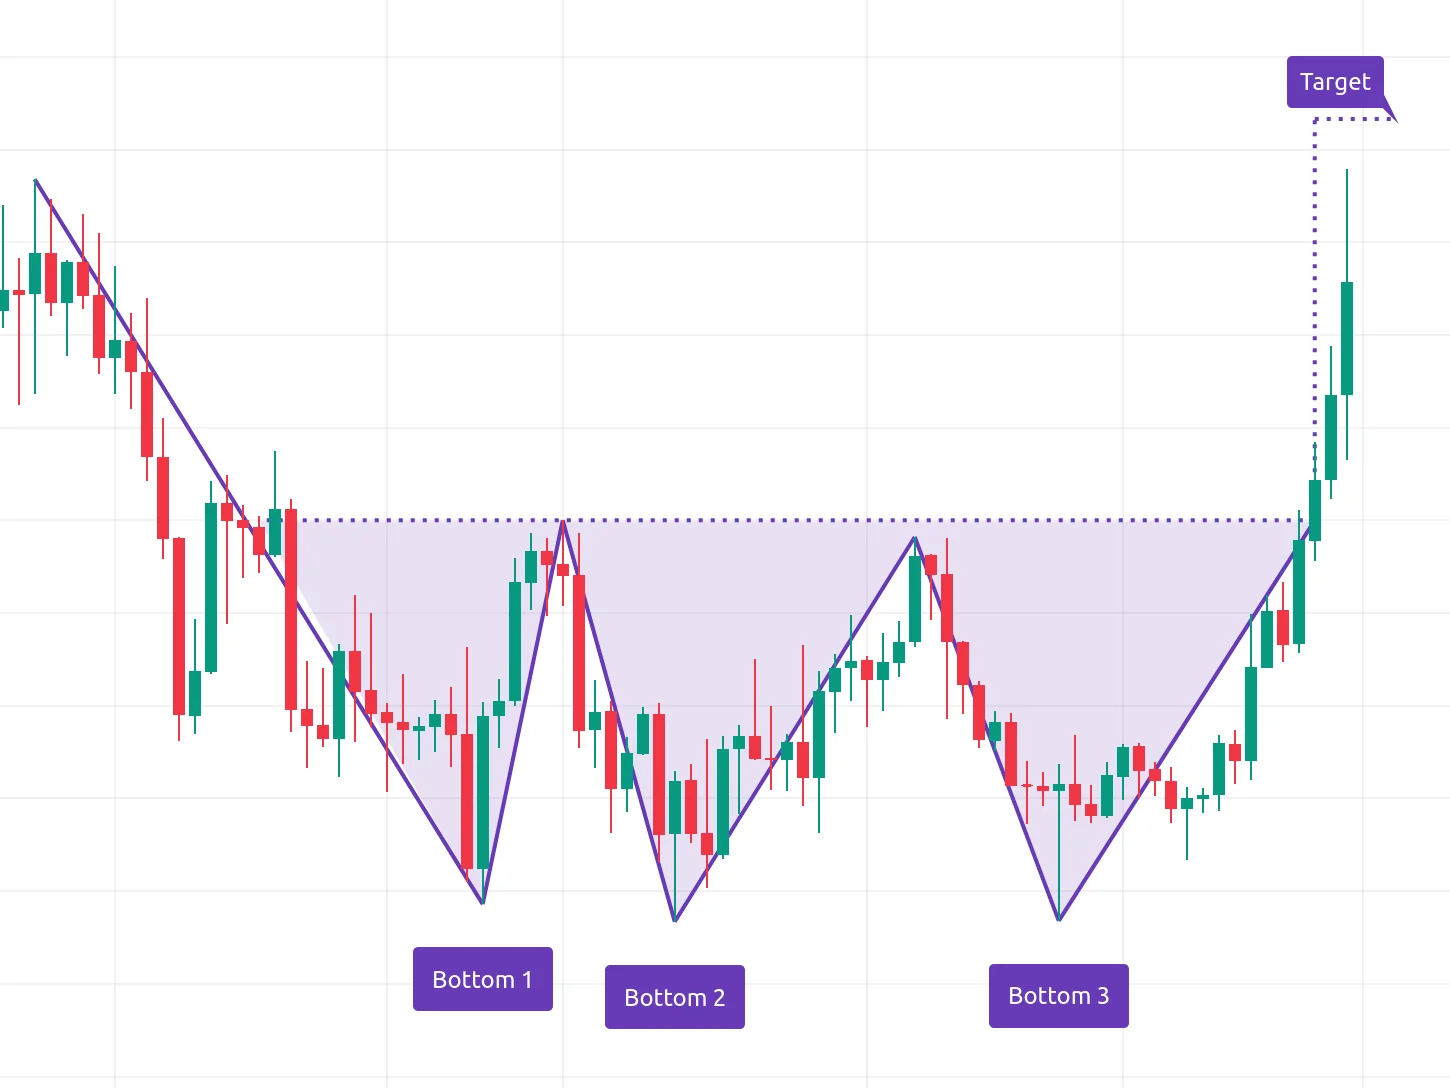
Triple bottom: three lows form around a support area after a decline. The intervening highs define resistance. A breakout above that resistance is the usual bullish trigger; three tests of support without the breakout remain an unfinished candidate. Define the permitted difference between lows and the required separation between them.
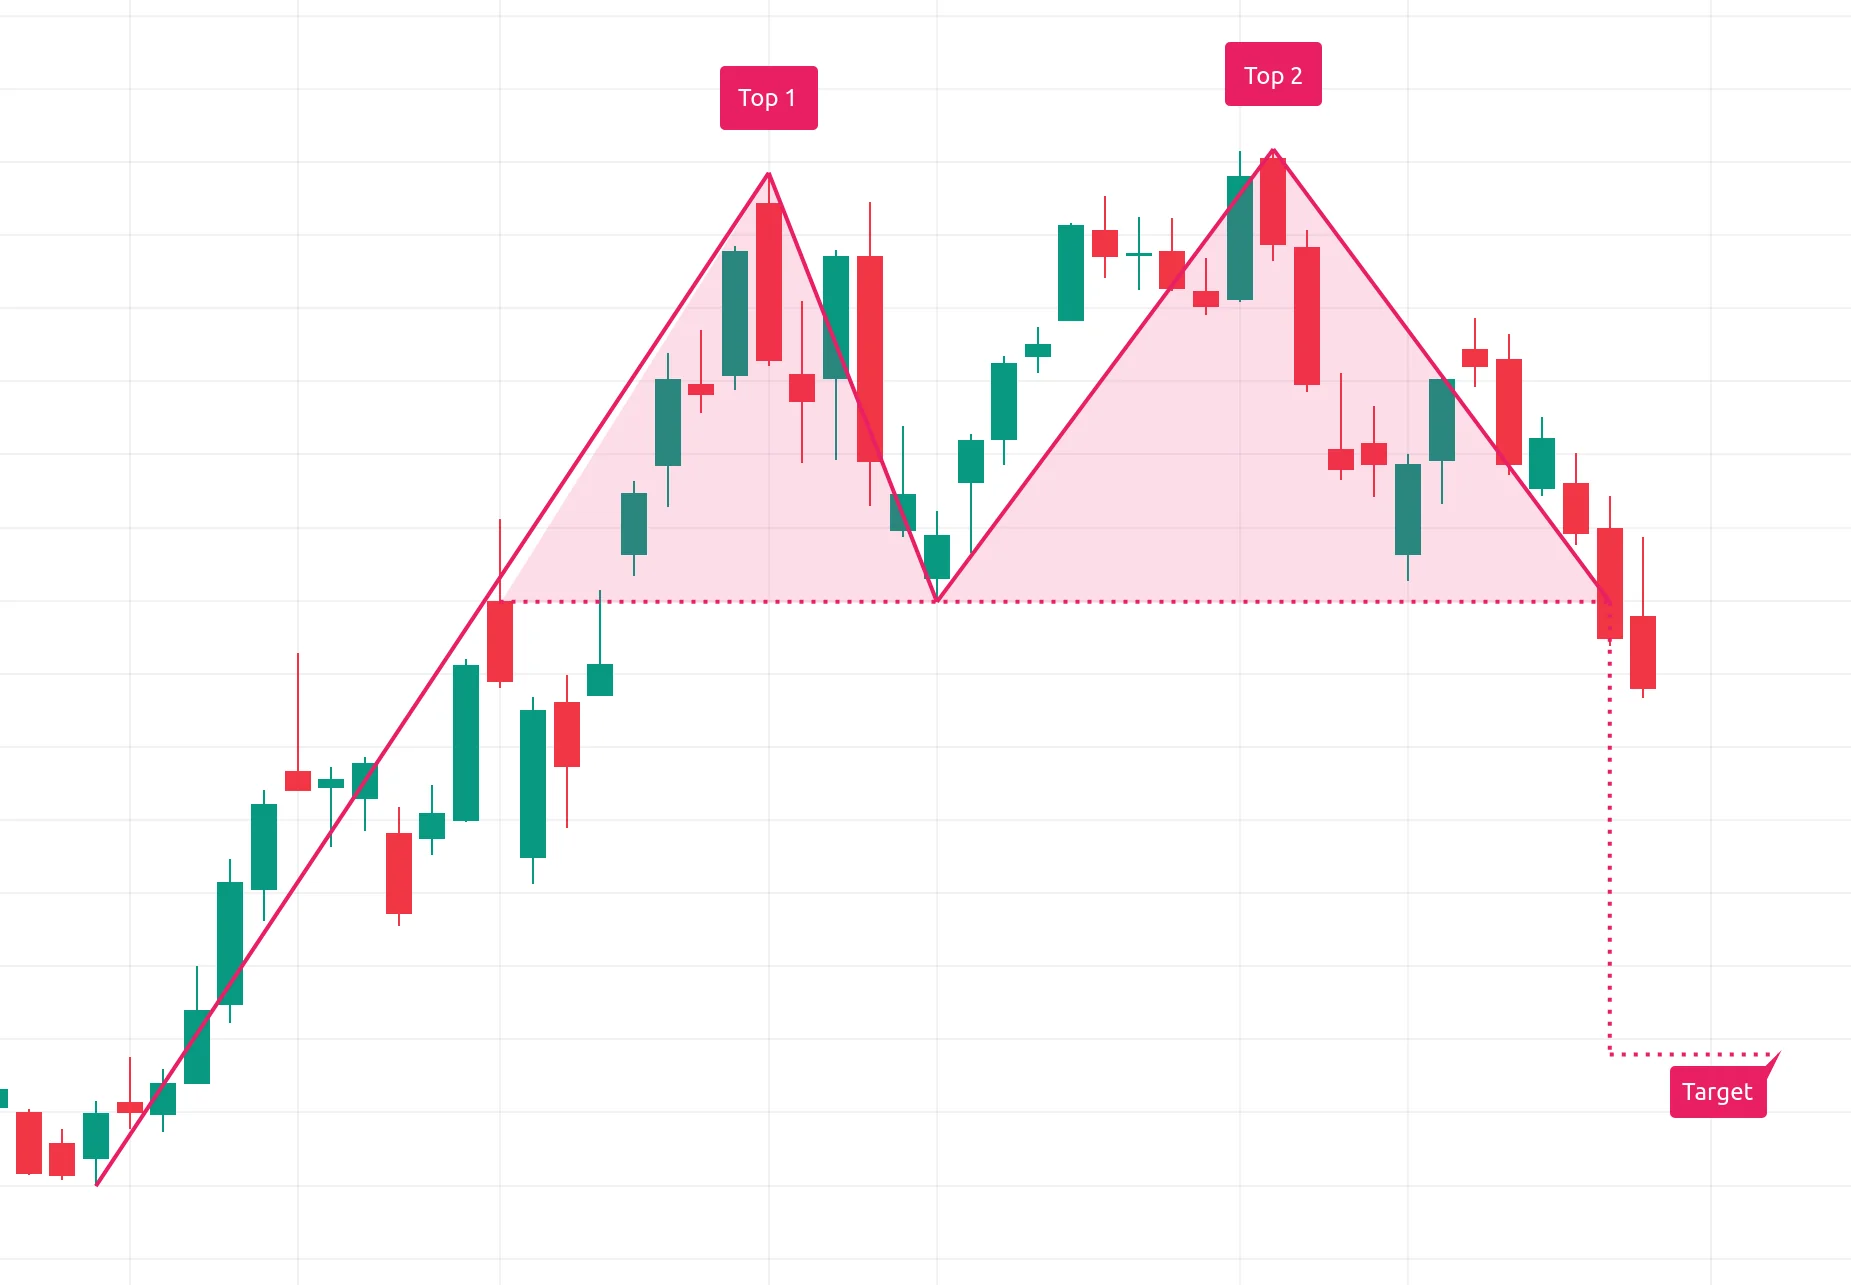
Double top: two peaks form near the same resistance area after an advance, separated by a meaningful decline. The low between them is the key support level. A completed close below that level can be a bearish trigger if that is the rule chosen in advance. The second peak may be slightly higher or lower; your tolerance must be explicit.
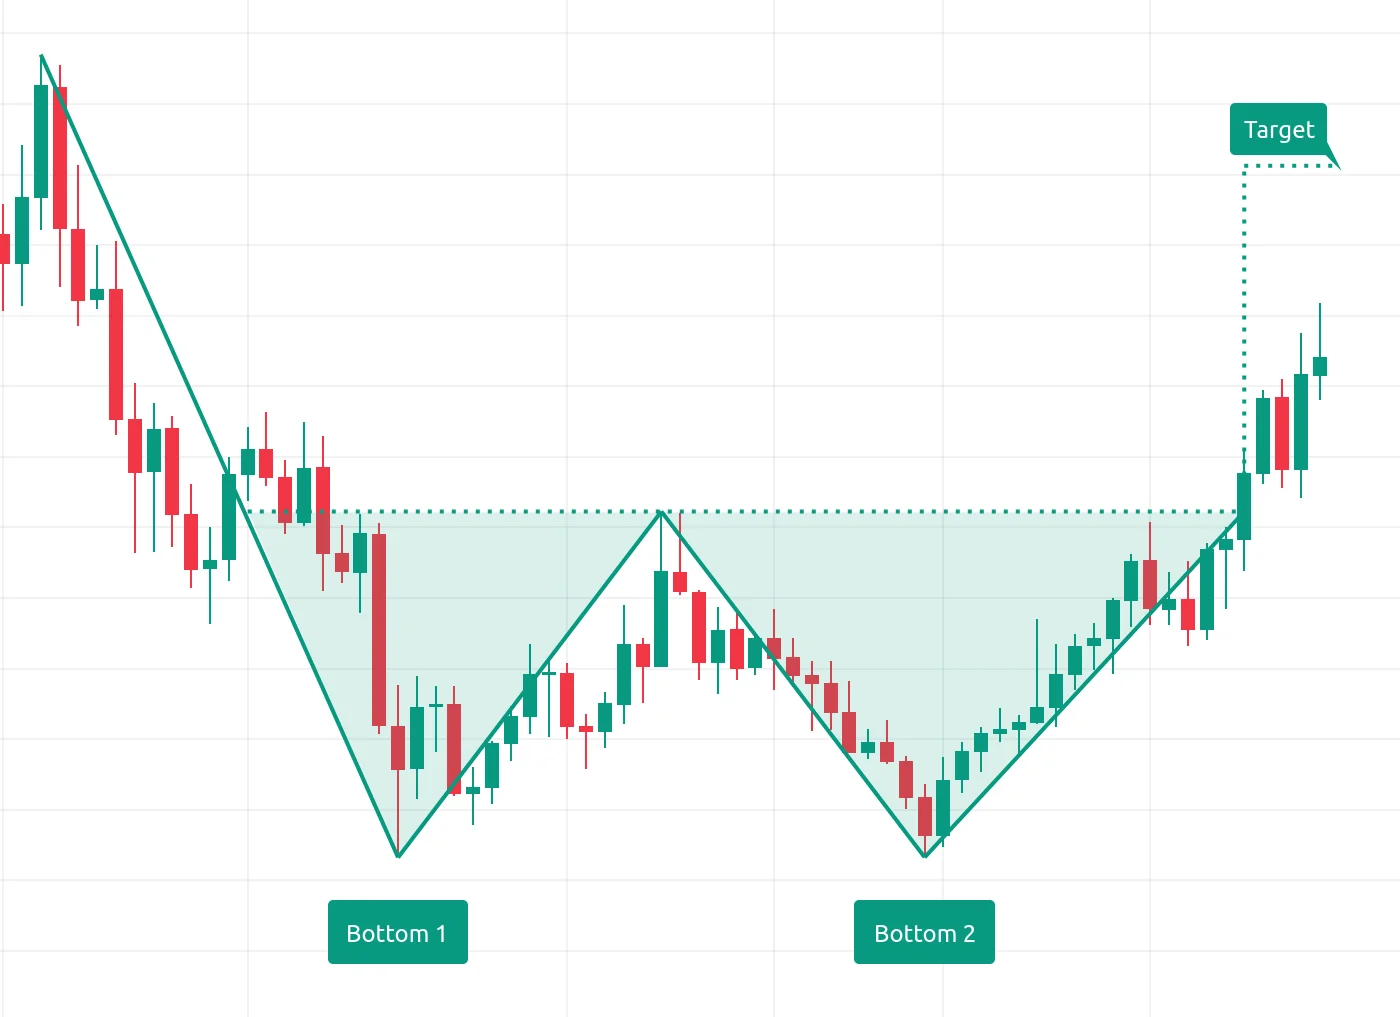
Double bottom: two lows form near support after a decline, separated by a rebound. A breakout above the intervening high provides the usual bullish trigger. Buying at the second low is an anticipatory strategy with different risks from waiting for the breakout; do not combine their results as if the entries were identical.
Trend Continuation Patterns
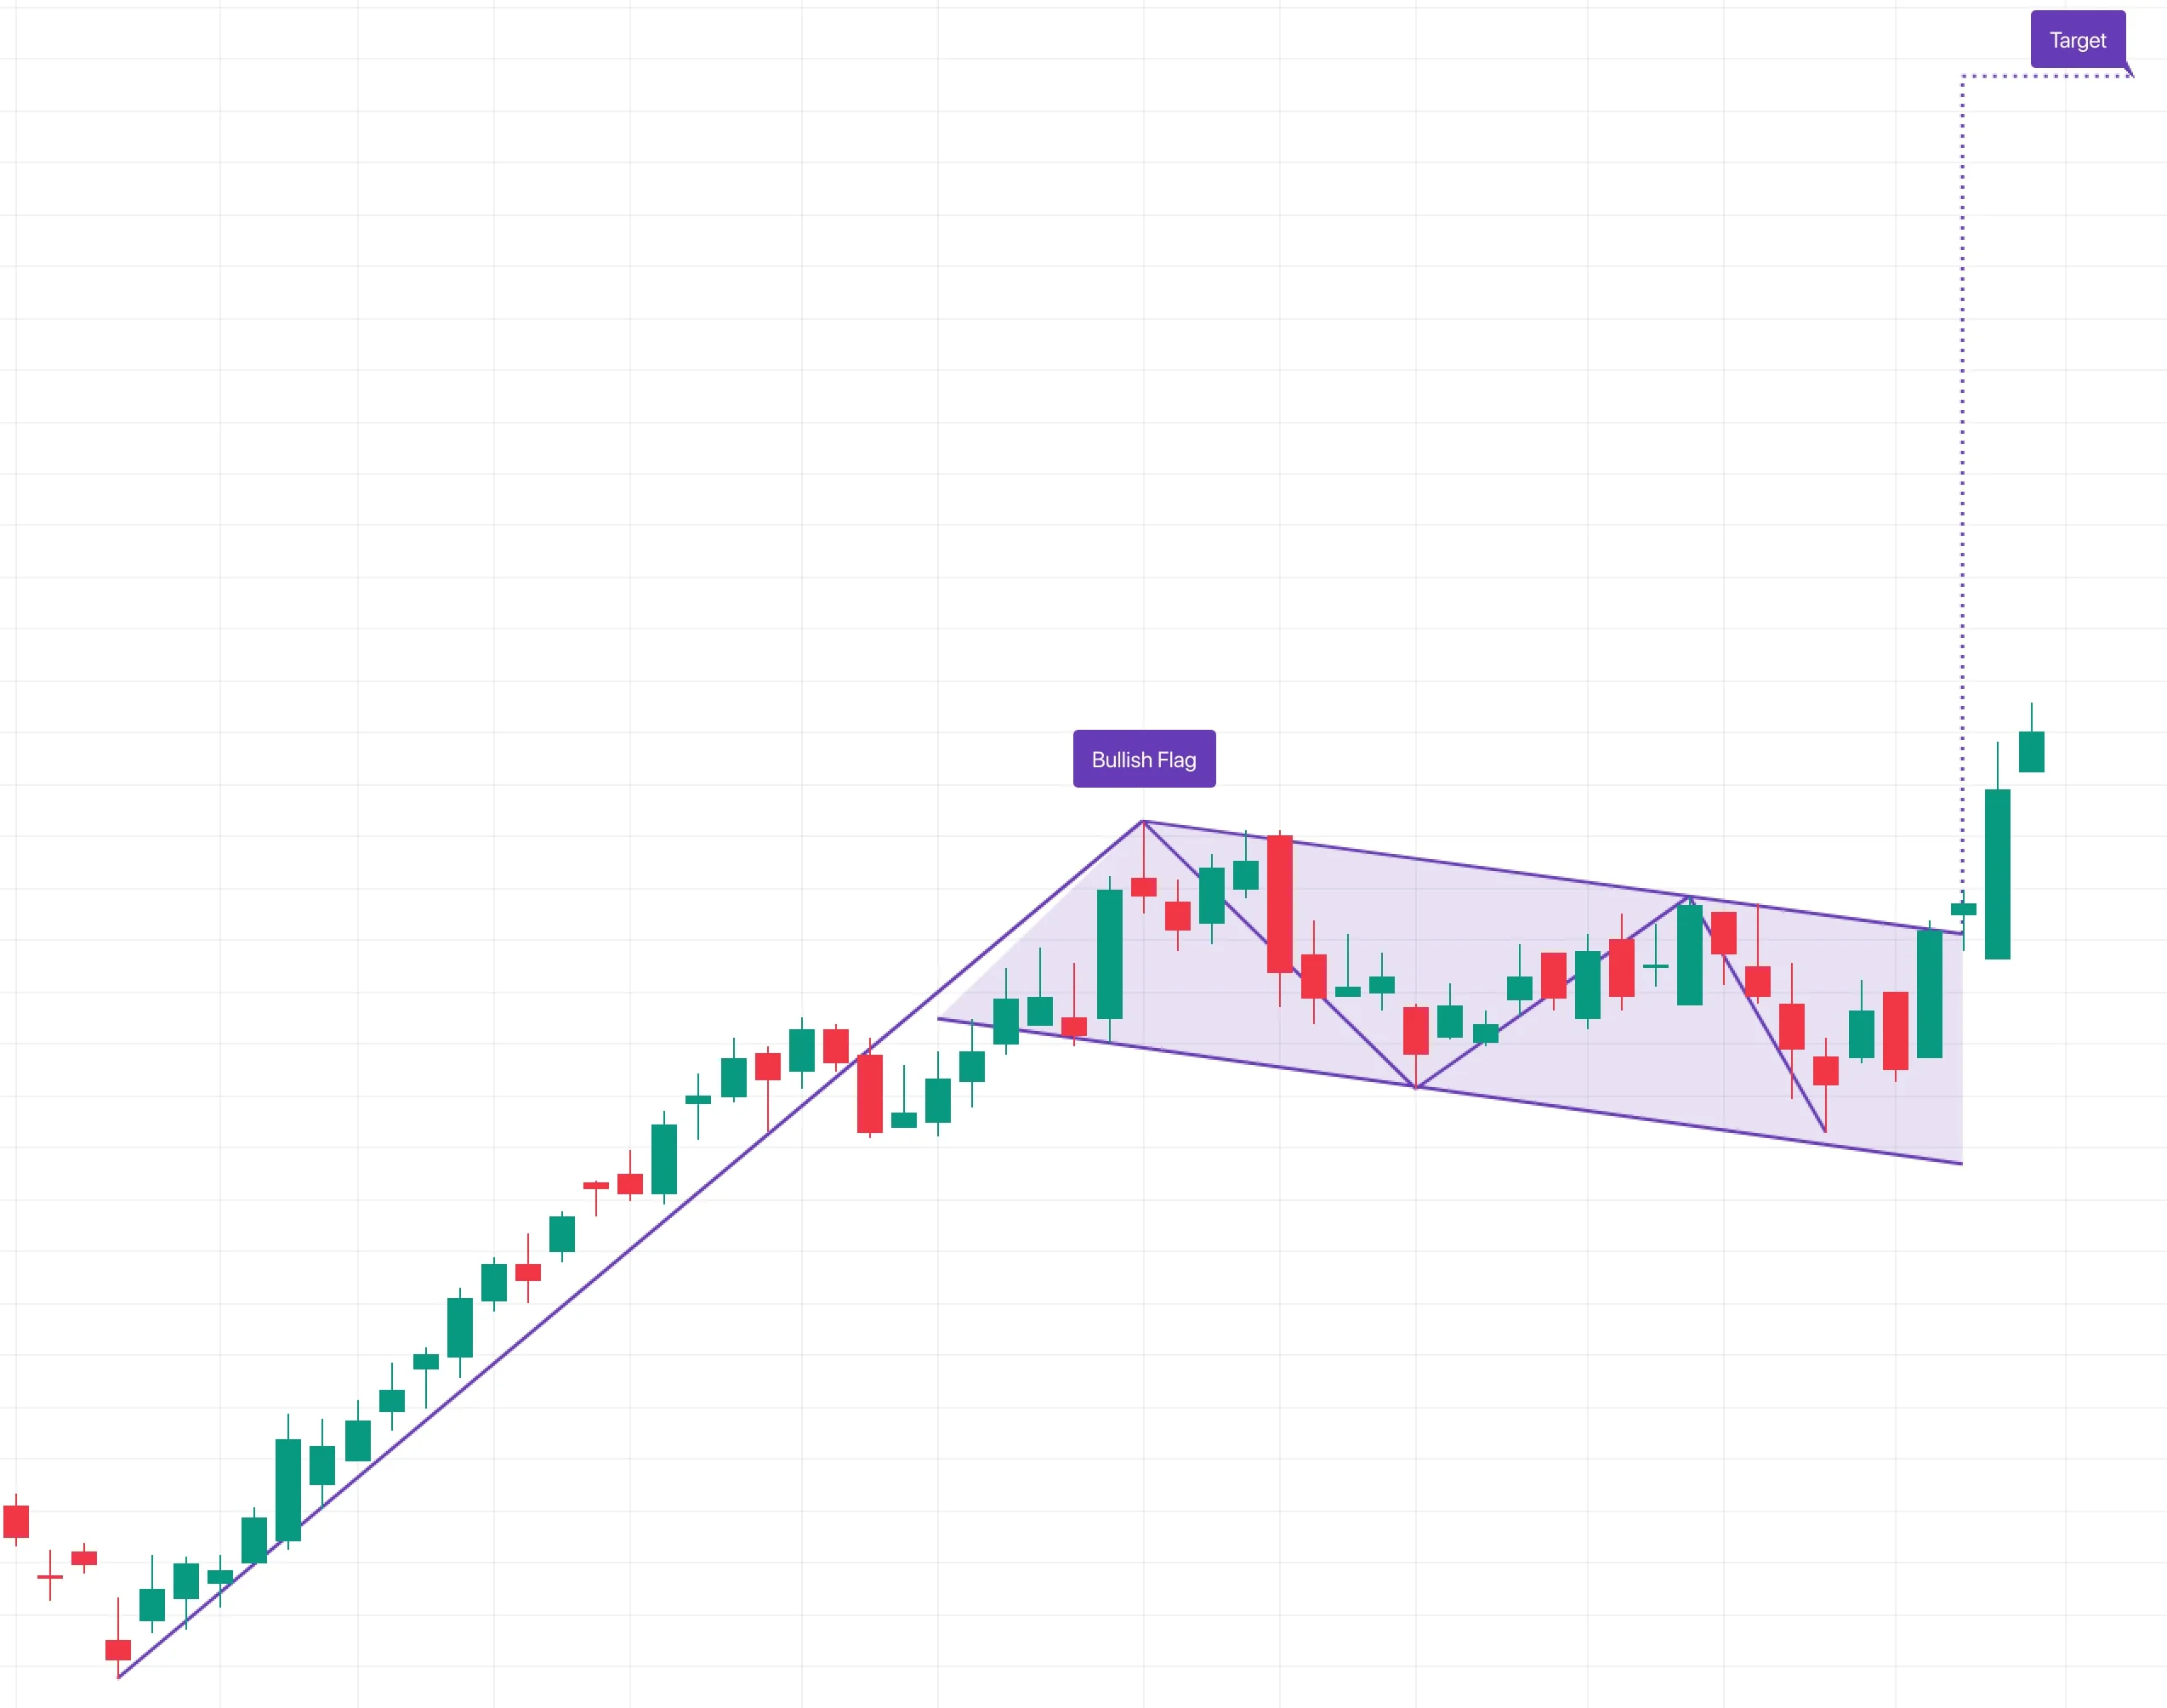
Flags and pennants: a flag is a short consolidation bounded by roughly parallel lines after a strong move; a pennant has converging boundaries. A bullish version looks for an upward resolution after an advance, and a bearish version looks for a downward resolution after a decline. Either can fail or break the other way. Specify the maximum duration and retracement allowed so ordinary ranges are not labeled flags after the fact.
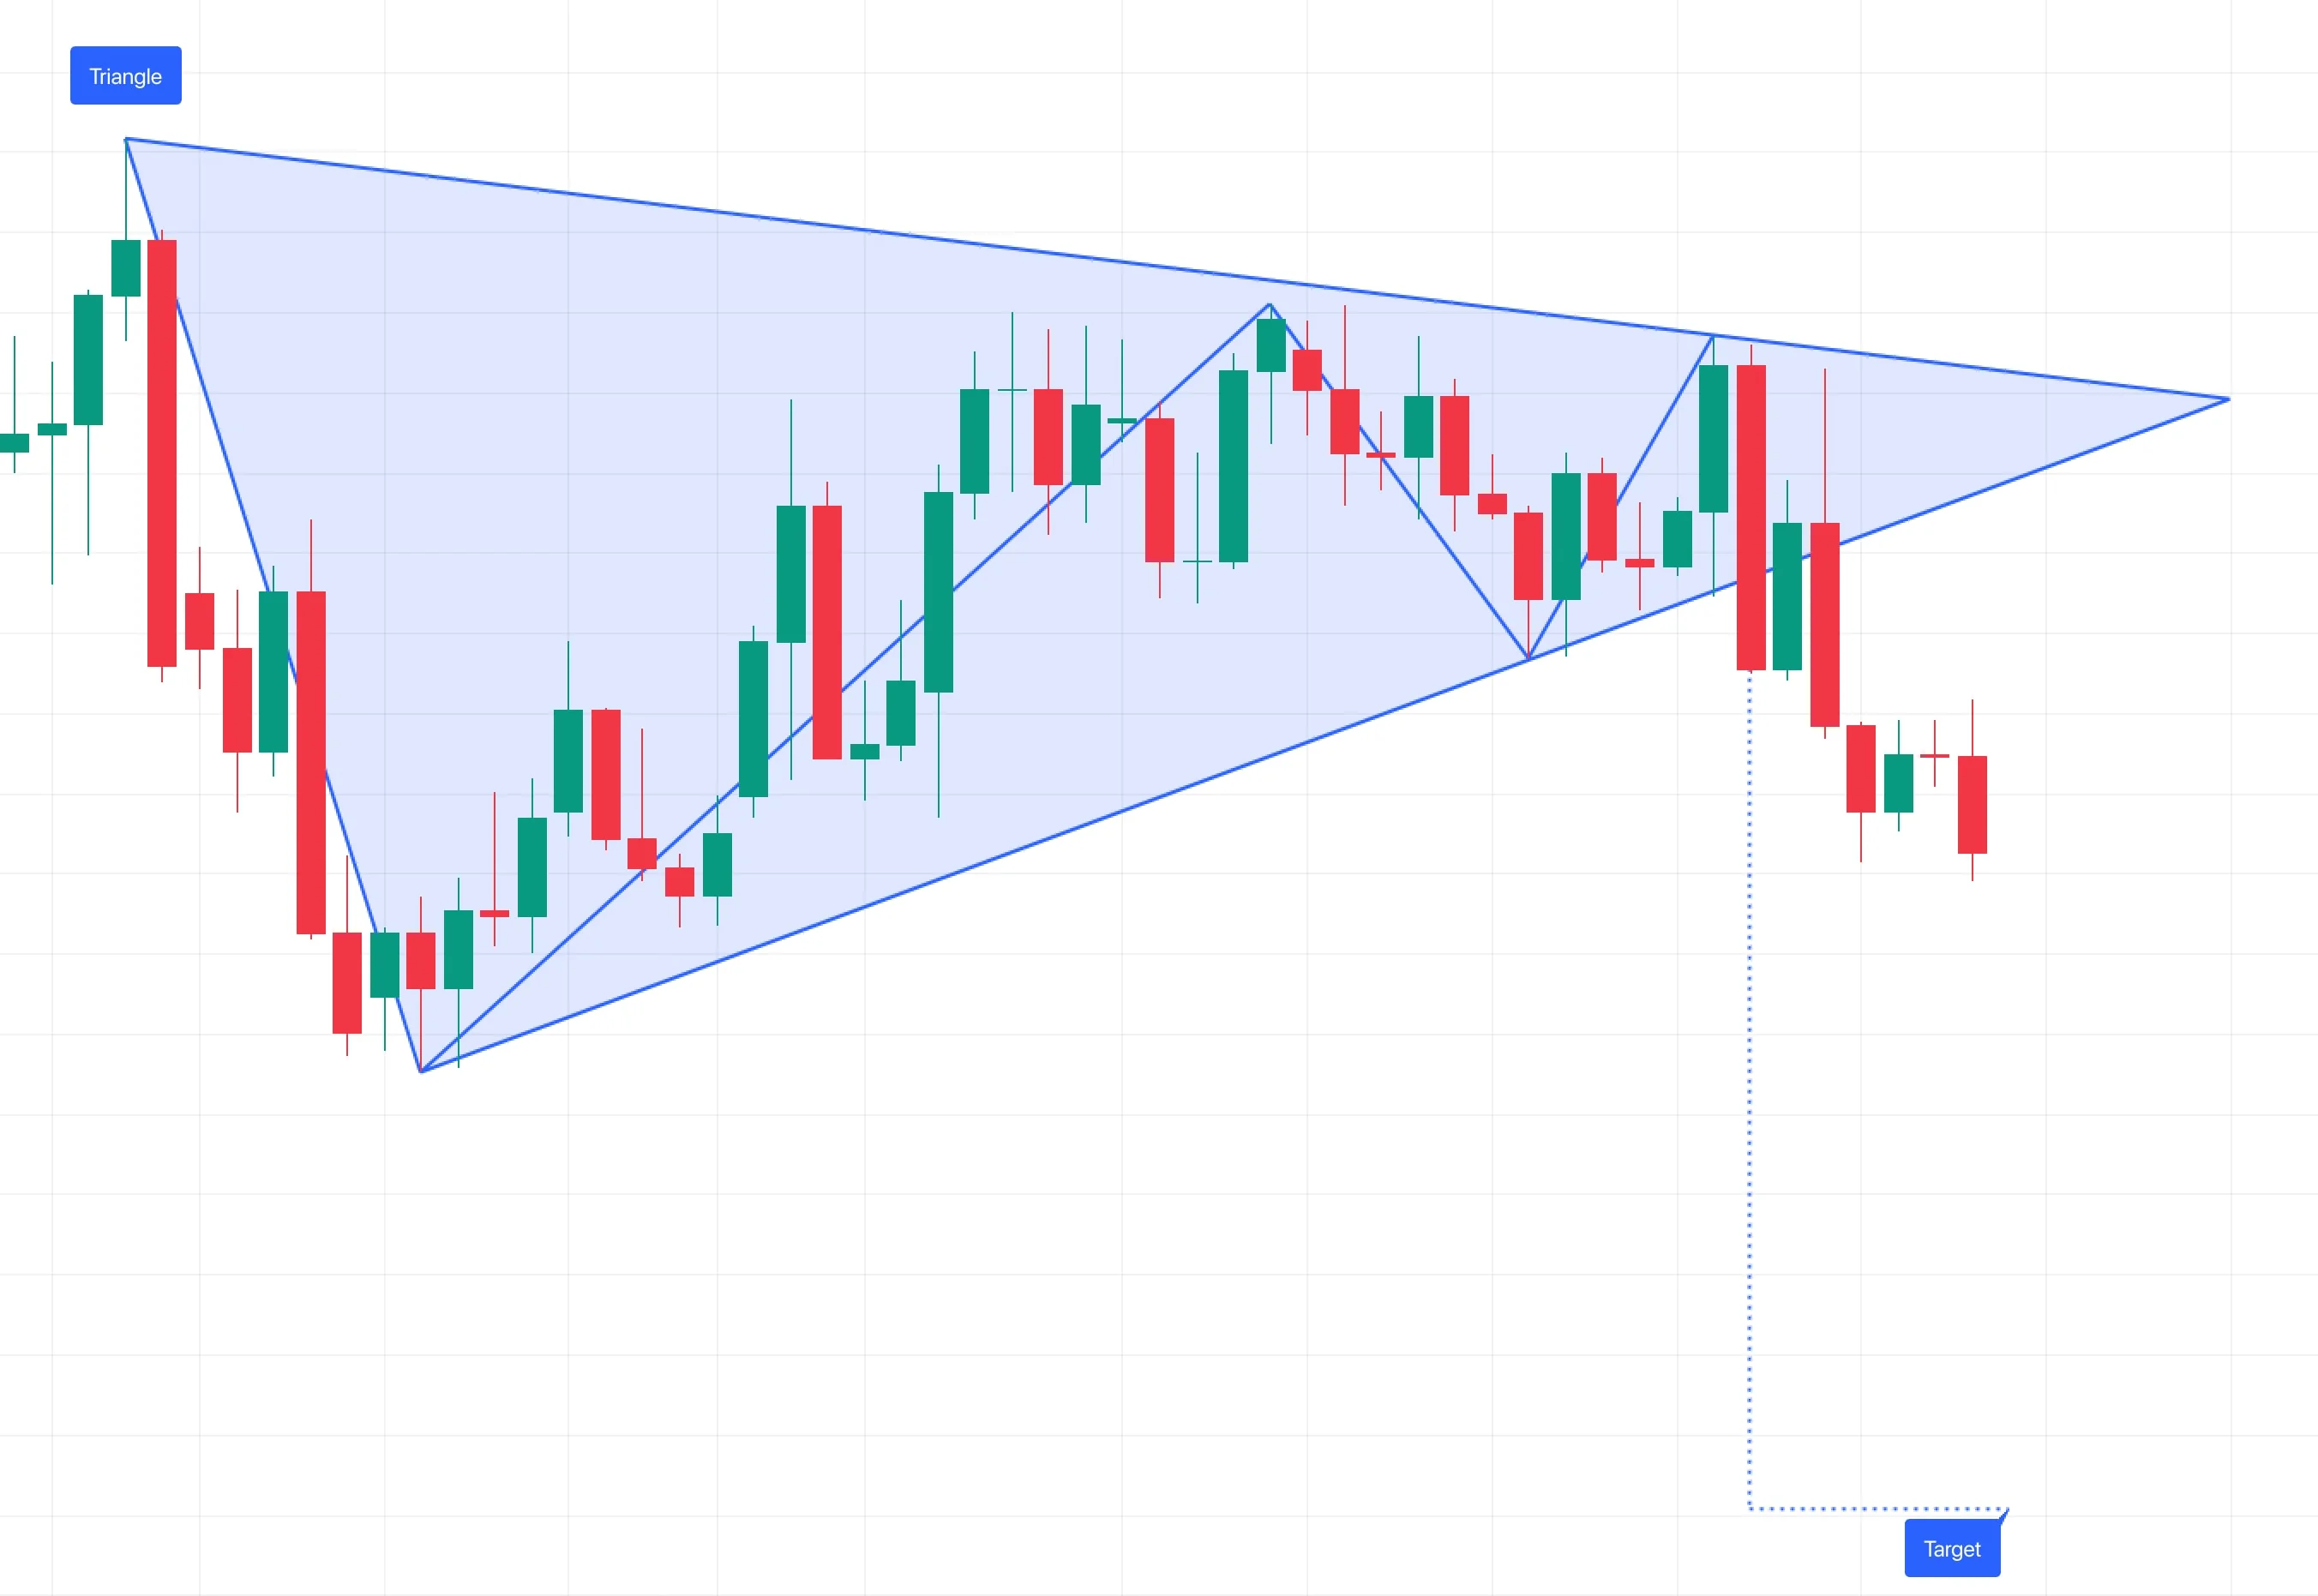
Symmetrical triangles: lower highs and higher lows create converging boundaries. Although often discussed with continuation patterns, a symmetrical triangle can break in either direction. Wait for your chosen breakout condition rather than treating the preceding trend as proof of the outcome. Ascending triangles have relatively flat resistance and rising lows; descending triangles have relatively flat support and falling highs. Their eventual direction also needs confirmation.
| Pattern | Observable structure | Example breakout condition |
|---|---|---|
| Head and shoulders | Three peaks, central peak highest, neckline through reaction lows | Completed close below neckline |
| Double or triple bottom | Repeated lows near support, intervening resistance | Completed close above resistance |
| Double top | Two peaks near resistance, intervening support | Completed close below the intervening low |
| Symmetrical triangle | Lower highs and higher lows | Completed close outside either boundary |
| Bull flag or pennant | Advance followed by a limited consolidation | Completed close above consolidation boundary |
Trading with Chart Patterns
Entry and Exit Points
Choose a trigger you can reproduce: a completed close beyond the boundary, a breakout followed by a successful retest, or an anticipatory entry inside the formation. These are separate methods. Waiting for a retest can miss trades that never pull back; entering immediately can expose you to false breaks. Test each method with the same costs and data assumptions.
Measured moves estimate an objective from the pattern’s height or flagpole. For a simple triangle whose initial height is 100 points, an upward breakout at 500 gives a projected objective of 500 + 100 = 600. A downward breakout at 500 would instead project 400. Use the relevant boundary price at breakout, particularly when it slopes. Nearby support or resistance may affect the practical exit plan.
The objective does not determine whether a trade is attractive by itself. Compare the actual entry with the stop and target. A late fill can increase risk and reduce the remaining reward. Standard candles provide traded-price context; synthetic chart prices require additional care when evaluating executable entries and exits.
Volume Analysis
Volume can describe participation in a breakout, but it does not certify success. Some formations show quieter trading as they contract, followed by greater activity on resolution. That sequence is a hypothesis to evaluate, not a universal requirement or an established win-rate boost.
| Stage | What to inspect | Important limitation |
|---|---|---|
| Formation | Whether volume contracts relative to a defined baseline | Quiet trading can also reflect an inactive market or session |
| Breakout | Completed-bar volume compared with comparable prior bars | A large spike can accompany exhaustion or a false break |
| Follow-through | Whether price holds beyond the boundary and activity persists | Higher activity alone cannot determine direction or continuation |
For example, breakout volume of 250,000 against a 100,000 baseline is 2.5 times the baseline, or 150% higher. This is a hypothetical calculation, not a claim about a specific Bitcoin event. Define whether the baseline is a 20-bar average, a same-time-of-day comparison, or another measure, and avoid comparing an unfinished candle with completed ones.
Check the feed. Exchange volume, a crypto venue’s activity, and forex tick volume measure different things. A pattern tested on one venue or session may behave differently on another. Do not label tick counts as total market trading volume.
Time Frame Selection
Intraday traders may examine five-minute through hourly charts, while swing traders may use daily and weekly views. These are examples of workflow choices, not reliability rankings. Shorter bars make spreads, slippage, and session effects more consequential; longer bars generally mean different holding periods and stop distances.
Keep pattern definitions consistent within each test. A daily formation cannot be counted as confirmed using the final daily close while assuming an entry earlier that same day. Record the symbol, venue, session, chart type, and time frame with every example.
Risk Control Methods
Stop Loss Placement
Place a proposed stop where the trade thesis is no longer acceptable, then check whether the resulting size and potential reward fit your plan. A trade exit can occur before the entire geometric pattern is invalidated. The levels below are examples to test, not mandatory stop locations.
| Setup | Possible protective reference | What to decide in advance |
|---|---|---|
| Bearish head and shoulders | Above the right shoulder or a defined failed-breakout level | A tighter trade exit need not invalidate the whole formation |
| Double top short | Above the second peak or specified resistance zone | How much tolerance is allowed around the peak |
| Double bottom long | Below the lower bottom or a later support level | Whether a later, tighter reference creates more frequent exits |
| Ascending triangle long | Below the recent higher low or reclaimed breakout level | Which event rejects the trade thesis |
| Bull flag long | Below the lower flag boundary or relevant swing low | How a moving boundary and volatility buffer are calculated |
An ATR-based buffer can adapt a price reference to recent volatility. A one-, two-, or three-ATR distance is a parameter to test, not a universal setting. Wider stops generally require smaller positions for the same planned loss. Stop-market orders may fill beyond the trigger during fast moves or gaps; stop-limit orders can remain unfilled. Review order types and execution limitations before assuming an exact exit price.
Position Size Rules
For a simple cash-equity example, planned units equal the loss budget divided by the distance between entry and stop, with an additional allowance for costs. Futures, forex, and other contracts require the correct multiplier, tick value, currency conversion, and minimum size. Account-wide exposure matters when several trades respond to the same market move.
Suppose a hypothetical long entry is 50, the stop is 48, and the target is 54. Price risk is 2 per share and potential reward is 4. With a total loss budget of 100 and estimated round-trip costs of 10, the calculation is (100 − 10) ÷ 2 = 45 shares. At the assumed stop fill, the loss is 90 + 10 = 100. At the target, the net gain is 180 − 10 = 170, giving a net reward-to-risk ratio of 1.7:1. A gap or greater costs can produce a larger loss.
A commonly discussed 1–2% account-risk range is not suitable for everyone and does not make a strategy safe. Select a budget based on drawdown tolerance, leverage, liquidity, and correlated exposure. Do not enlarge a position merely because a formation looks textbook-perfect or several indicators agree.
Pattern Failure Response
Define failure before entry: for example, a completed close back inside the broken boundary, a break of a specified swing, or no follow-through within a stated number of bars. Decide which events trigger an exit and which are observations only. A time-based exit can limit exposure to a stalled setup, but it can also close a trade before a delayed move.
After an exit, record the planned and actual fills, costs, screenshots, and reason. Separate execution errors from valid losses under the rules. Avoid widening the stop or immediately reversing direction simply to recover a loss. A failed bullish breakout is not automatically a tested short strategy.
Advanced Pattern Techniques
Multiple Time Frame Analysis
Use a higher time frame to describe context and a lower one for a separately defined trigger. For example, a daily chart can show a resistance zone while a four-hour chart supplies a completed breakout close. Use only information available at that moment: an unfinished daily candle can change before its close.
Alignment may filter trades, but it can also reduce the sample and delay entries. Compare the pattern alone with the added higher-time-frame rule over the same dates. Report trade count, drawdown, and net performance; there is no universal percentage improvement from adding another time frame.
Pattern and Indicator Combinations
Choose each indicator for a specific question. A moving average can define trend context; RSI can describe recent momentum; MACD can describe the relationship between smoothed prices. RSI above 70 or below 30 does not force a reversal, and a MACD divergence does not itself prove a breakout. For calculation differences, see the trading indicators FAQ.
Avoid treating several transformations of the same price series as independent votes. Specify an indicator’s period, threshold, and timing, then test whether it improves the baseline after costs on a separate period. Adding conditions until a historical chart looks convincing increases the risk of overfitting.
Charting and Testing Patterns in Native LuxAlgo
Open a supported symbol in LuxAlgo charts, choose the intended time frame, and use drawing tools to mark swings and boundaries. Add available indicators only when they answer a defined question. Arrange related views in a workspace to compare context without losing the original setup.
Quant, our coding agent, can help turn a pattern hypothesis into a strategy script. Describe swing confirmation, similarity tolerance, minimum separation, breakout timing, order execution, stop, target, sizing, and costs. Inspect the generated code and run it manually on the intended chart. A prompt alone does not validate the pattern logic or the results.
A testable double-top specification might require two confirmed pivot highs within 1% of each other, separated by 5–30 bars, with a completed close below the lowest low between them. Those numbers are illustrative settings to evaluate. If a pivot needs three later bars to confirm, the script must wait for them; it must not place a historical trade at the earlier pivot as if confirmation were already known.
In the strategy viewer, inspect individual trades as well as aggregate results. Include commission and slippage, confirm how orders fill, and check a later period that was not used to choose settings. Review false breaks and missed setups. Historical profitability does not ensure future profitability.
LuxAlgo Pattern Detection
Pattern tools in the Library detect supported formations on a Quant Chart. A detection alert indicates the tool’s conditions were met, not that a target will be reached; check timing and retrospective behavior before using historical labels as entry evidence. Automated recognition makes a defined scan more consistent, but it cannot remove ambiguity, and it is not the same as asking Quant to turn the pattern into a strategy and backtest it.
How to Apply Chart Pattern Analysis
- Choose one formation and define its prior trend, swings, boundaries, and timing.
- Save examples before the outcome is known, including candidates that never break out.
- Write the entry, rejection criteria, stop, target, position size, and cost assumptions.
- Test a simple baseline before adding volume, indicators, or multiple time frames.
- Inspect trades individually and review a separate period before considering real exposure.
Traditional patterns are most useful when they make a trading idea explicit. Preserve the distinction between recognizing a shape, confirming a signal, and executing a trade at an achievable price. Better records and reproducible rules provide more useful feedback than unsupported accuracy claims.
FAQs
How do you trade a double top?
Identify two peaks after an advance and mark the low between them. A breakout-based method waits for a defined close below that low, then applies a preplanned stop, target, position size, and execution rule. Two similar peaks alone do not complete the bearish setup.
Are symmetrical triangles continuation patterns?
They are often discussed as continuation formations, but they can resolve in either direction. Define a breakout beyond the upper or lower boundary rather than assuming the preceding trend will continue.
Does higher breakout volume guarantee success?
No. Compare completed-bar volume with a stated baseline and account for the feed and session. Higher activity can accompany follow-through, exhaustion, or a false breakout.
Can LuxAlgo detect chart patterns automatically?
Pattern tools in the Library detect supported formations on a Quant Chart. Drawings support visual analysis, and Quant can code explicit rules for inspection and testing.
What should you do when a chart pattern fails?
Follow the exit conditions defined before entry, such as a reclaimed boundary, a breached swing, or a time limit. Record the result and execution costs. Do not assume that a failed pattern automatically supplies a valid trade in the opposite direction.
Read next