Ultimate Guide to Market Open and Close Trading

Trading around the market open and close requires a plan for timing, price levels, order execution, and risk. A gap can continue or reverse, and a busy closing session does not reliably predict the next day’s direction. Define the setup before the session begins, then test the actual decisions you could have made.
This guide uses US stock-market examples. Futures, forex, crypto, and overseas exchanges have different calendars and session conventions. In LuxAlgo charts, you can organize session analysis with price, volume profiles, and VWAP, then use Quant, our coding agent, to build and review a defined time-of-day strategy.
Know the session and the auction
The NYSE core stock session normally runs from 9:30 a.m. to 4:00 p.m. Eastern Time. Check its official trading calendar for holidays and early closes, including specified 1:00 p.m. equity closes. Use a daylight-saving-aware New York timezone rather than a fixed UTC offset.
| Period | What to establish | Common mistake |
|---|---|---|
| Before the regular open | News, prior close, available pre-market prices, spread, and the day’s calendar. | Treating a pre-market quote as the guaranteed opening price. |
| Opening auction and first bars | Which venue supplies your prices and when the chosen opening range finishes. | Using the final range before all its bars have occurred. |
| Last part of continuous trading | Last entry time, exit policy, order type, and remaining time. | Opening a trade that cannot meet its planned holding period before the cutoff. |
| Closing auction | Exchange and broker eligibility, deadlines, and cancellation restrictions. | Assuming an ordinary order sent near the close must receive the official auction price. |
The NYSE auction timeline says its opening process begins at 9:30 a.m.; an individual security can open later. For the NYSE closing auction, the normal MOC/LOC entry cutoff is 3:50 p.m., with specified exceptions for orders offsetting a significant imbalance. Other NYSE-operated venues have different deadlines. Your broker may impose an earlier cutoff, so verify its current instructions.
A market-on-close order seeks auction execution; a limit-on-close order adds a price condition and may not fill. Neither is simply a label for “sell sometime before 4 p.m.” Auction imbalances are specific exchange data, not the same thing as candle volume or footprint delta.
Compare opening and closing setups
Gap fading: a move toward the previous close
A gap fade takes the opposite direction to the opening gap. First define the reference: for example, the prior regular-session close and today’s selected regular-session opening price. A stock moving from a $100 prior close to a $102 open has a 2% upward gap under that convention.
A hypothetical short entry at $101.50, stop at $102.50, and target at $100 has $1 of planned price risk and $1.50 of potential reward per share—1.5R before costs. Setting a stop to “half the gap” does not automatically produce 2R because the actual entry location matters.
Specify the trigger, maximum entry time, short availability, invalidation, and what happens if the gap never fills. There is no universal 0.5%–1.5% gap range that establishes a profitable fade. Earnings or other information can support a lasting repricing rather than a return to yesterday’s close.
Gap continuation: participation in the gap’s direction
A continuation setup looks for movement in the gap’s direction after a defined trigger. That might be a completed-bar breakout of an opening range or a retest of a level known in advance. “Wait until the trend holds” is not enough: decide what price action qualifies, when it must happen, and where the idea fails.
Volume can add context, but heavy trading occurs during both successful and failed moves. Compare like-for-like windows and data sources rather than treating every volume spike as confirmation.
Closing-session continuation or reversal
A late-session setup can study continuation beyond a previously defined range or rejection back into it. Choose one hypothesis and write an entry cutoff and exit rule. A reversal should be a measurable price condition, not an assumption that institutions must be taking profits.
Separate a strategy that exits during continuous trading from one designed for the closing auction. If your decision requires the final daily close, that information is unavailable before the closing auction completes. Do not award a backtest that same closing fill unless the order could actually have been submitted under the strategy’s rules.
Worked example: an opening-range plan
For a hypothetical long-only stock setup, define the opening range as the three completed five-minute bars covering 9:30 a.m. up to 9:45 a.m. New York time. Its final high and low become usable at 9:45. Begin evaluating subsequent bars after that point.
Suppose the range high is $112 and its low is $111. A possible trigger is the first later five-minute bar that closes above $112 while flat. If the 9:45–9:50 bar triggers, a next-bar-open simulation enters no earlier than 9:50. The price will not necessarily equal $112.
Assume an actual fill at $112.20, a predefined stop at $111.30, and a target at $114. Planned risk is $0.90 per share; a $90 budget permits 100 shares before costs and capital limits, requiring $11,220 of purchase exposure. The $1.80 target distance is 2R before costs. A gap or halt can still produce a larger loss than planned.
For a complete test, also specify one attempt or multiple attempts, stop activation, simultaneous stop/target handling within a bar, and the latest allowed entry. One illustrative schedule prohibits new fills in the final 30 minutes and exits remaining positions 15 minutes before the scheduled close. That means 3:30/3:45 p.m. on a normal day, or 12:30/12:45 p.m. for a 1:00 p.m. close.
Implement those as execution deadlines, not merely signal times. A signal generated just before the cutoff may fill too late on the next bar. Verify the time-exit order while the market is still open; missing bars, halts, or unfilled orders need an explicit exception policy. This example is a research specification, not a tested performance claim.
Use session data in LuxAlgo
Volume profiles: where activity occurred
LuxAlgo’s volume profiles organize traded volume by price. Choose the measurement window and keep it consistent. Session and Rolling profiles use footprint data where supported; Visible Range Volume Profile uses candle volume and an up/down classification, and changes with the visible chart range.
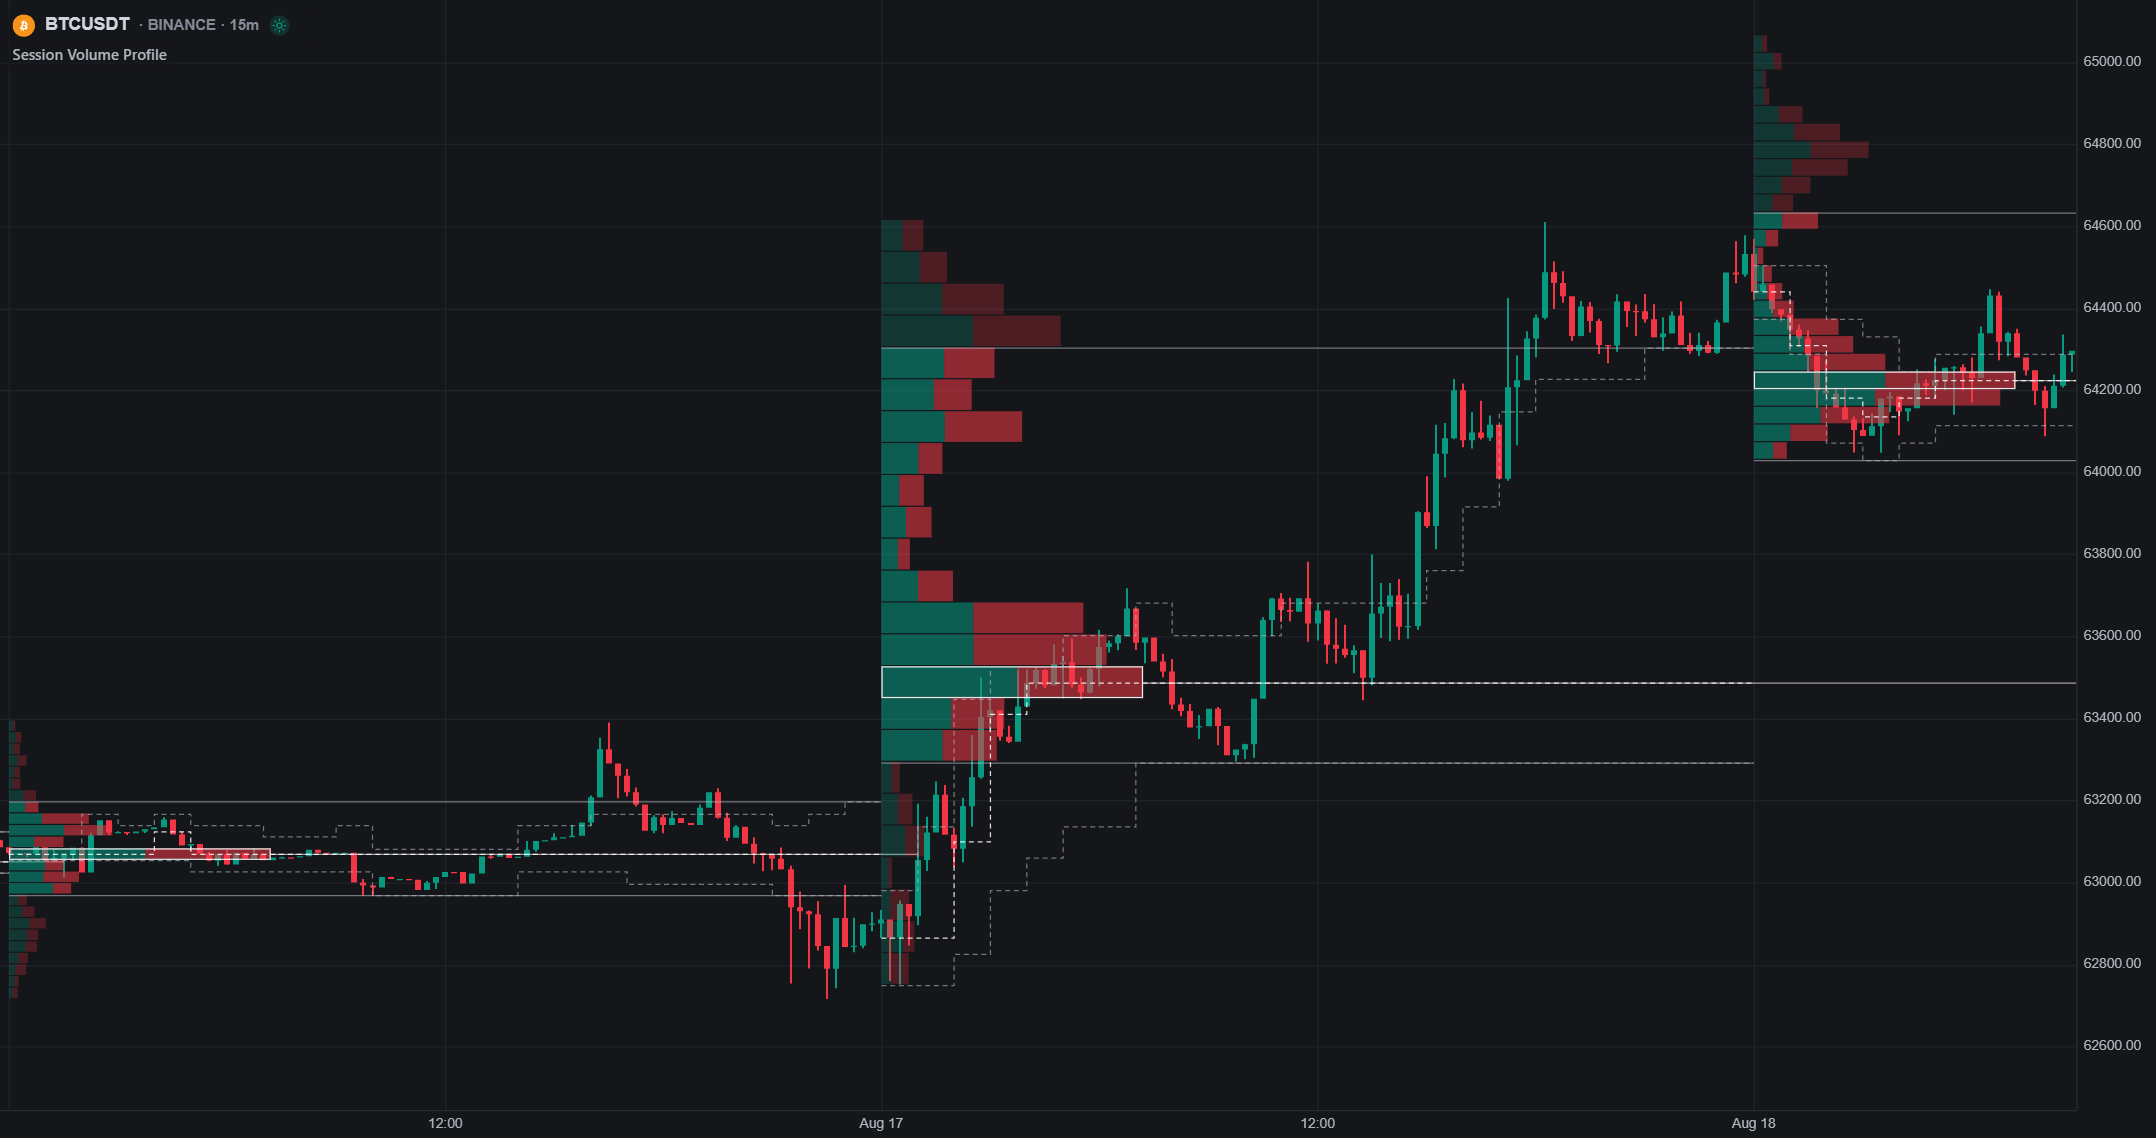
A completed prior-session profile can be a reference for the next session. Today’s developing profile uses only trading that has occurred so far. Do not use its final point of control or value area to justify an earlier entry.
VWAP: check the anchor before comparing prices
LuxAlgo’s native VWAP Bands uses candle price and volume. Its documented Day, Week, and Month anchors use UTC periods, with HLC3 as the default price source. That means a Day setting should not be assumed to mean “restart at the 9:30 a.m. US-stock open.”
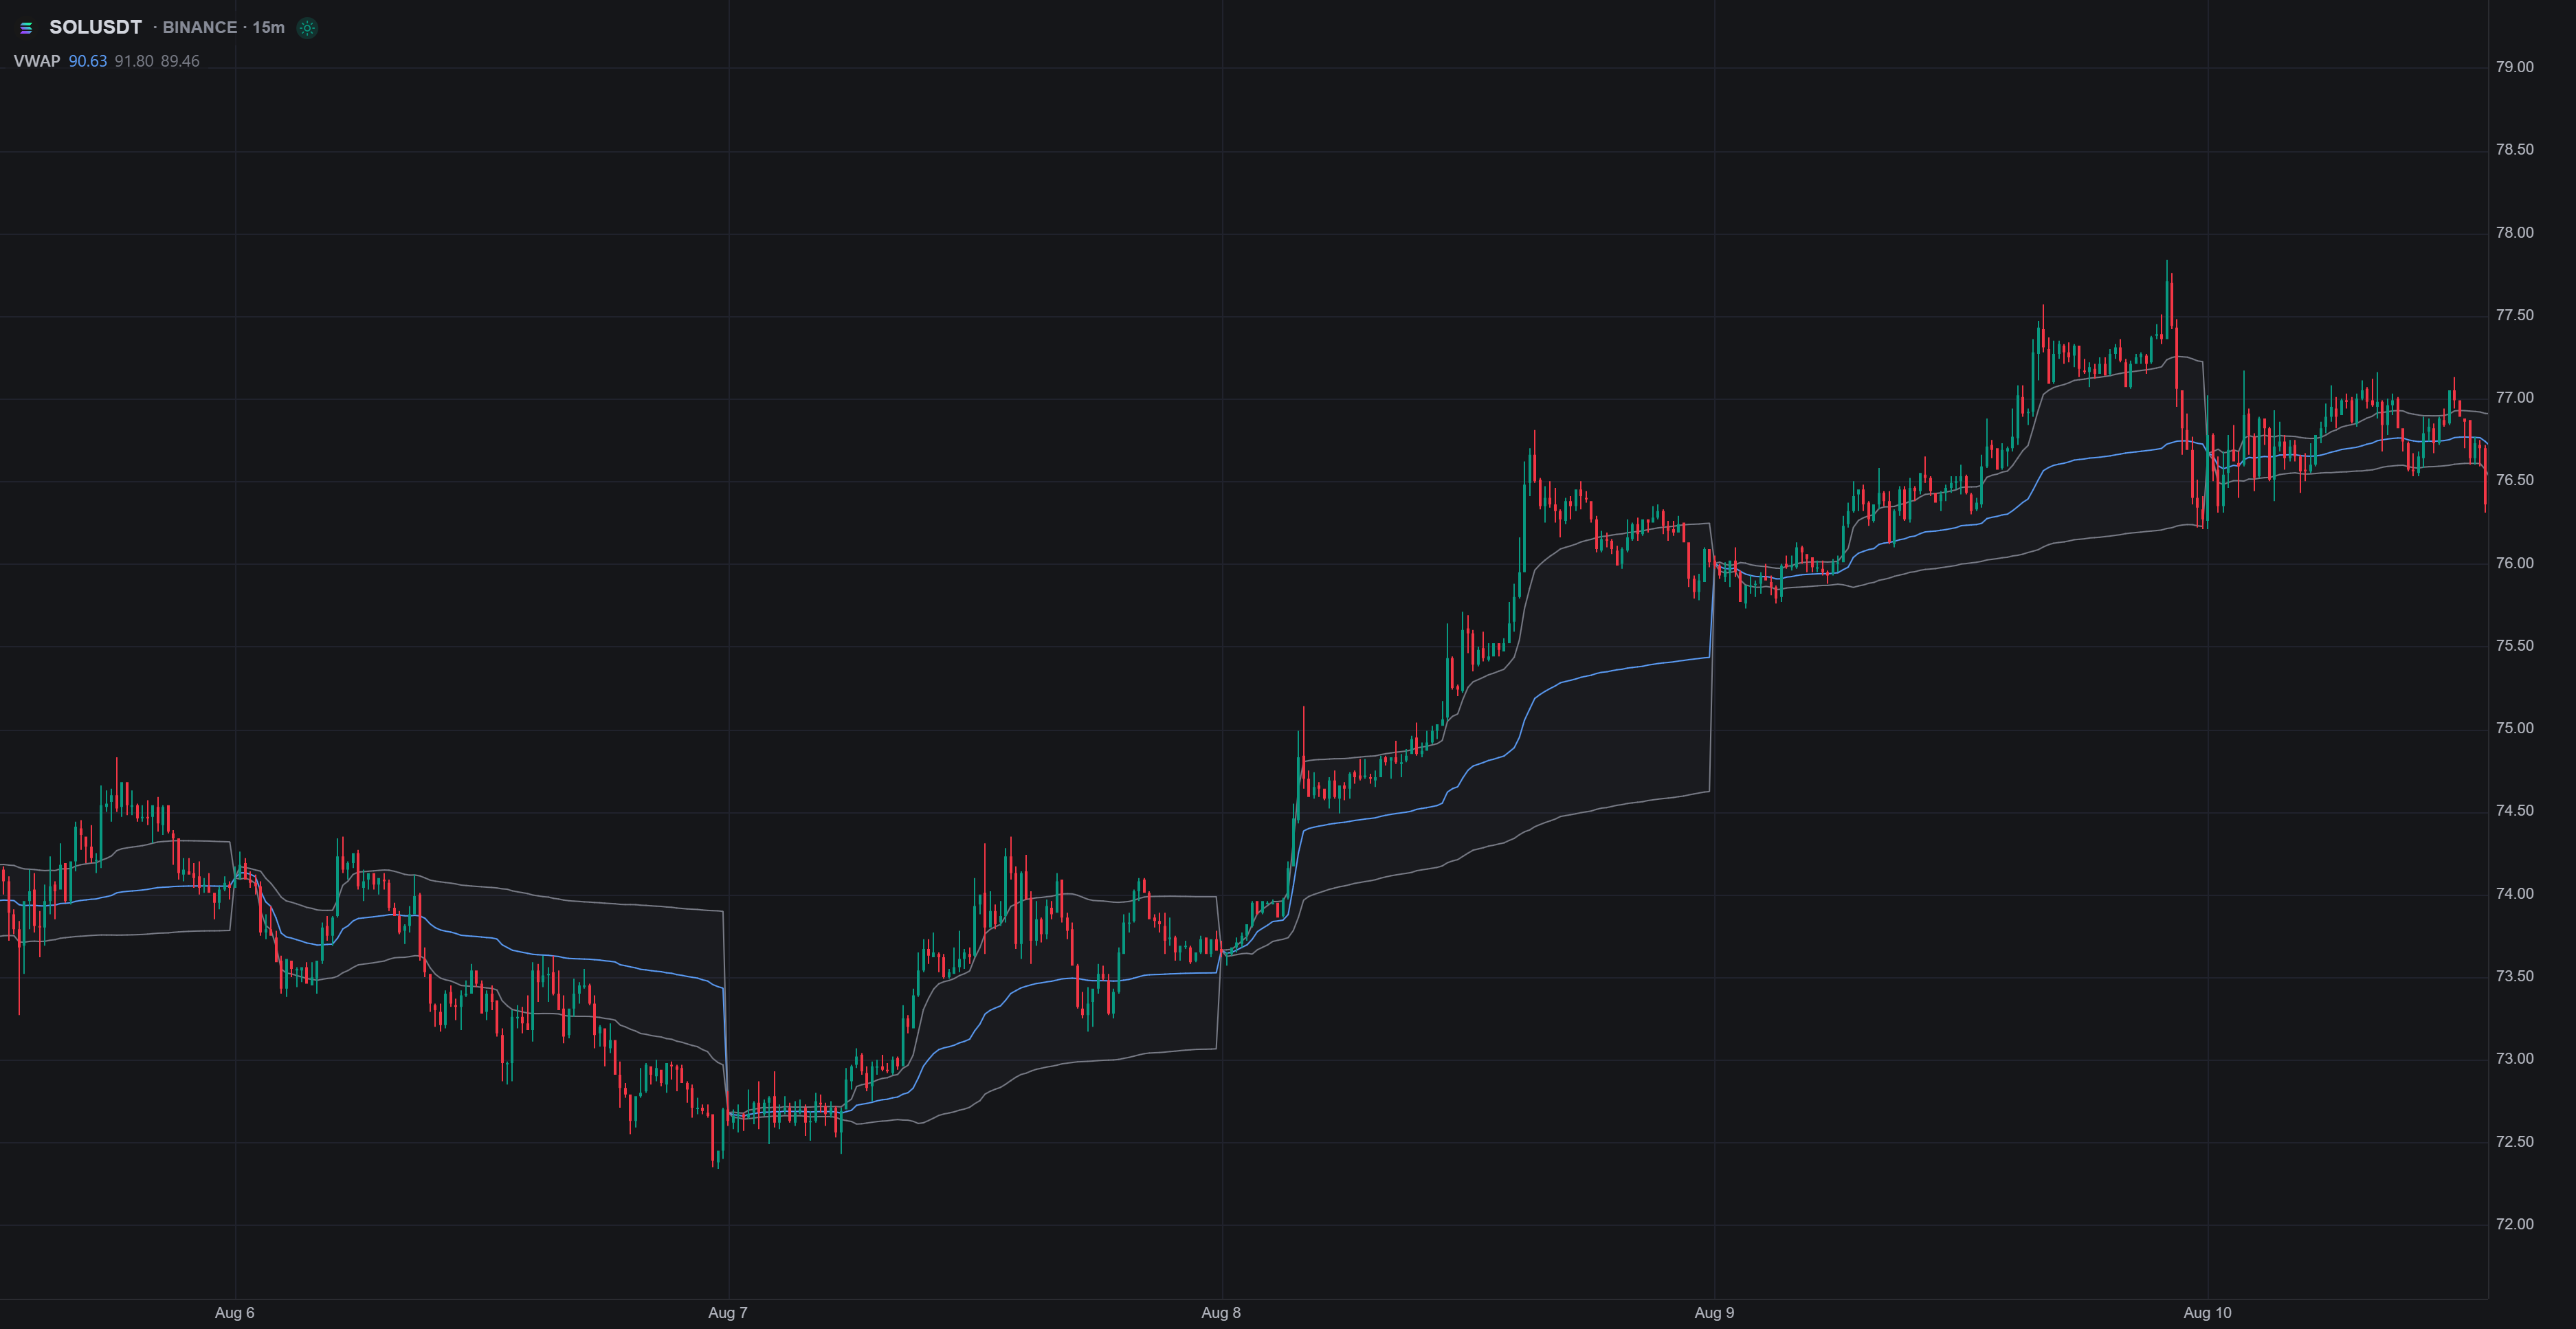
If your rule specifically needs a regular-session reset, define that behavior and verify its implementation. Price above a VWAP reference does not reveal every participant’s entry price or prove that all holders are profitable.
Session overlays and ICT windows
The open-source Sessions [LuxAlgo] indicator can mark configured session windows. ICT Killzones [LuxAlgo] marks selected time intervals and can display Fibonacci retracements from their ranges. These are analysis conventions, not exchange calendars or proof of institutional order placement.
The ICT script’s documentation warns that intervals above one hour can display incorrect windows and that retracements change while the relevant window is active. Check timezone behavior and completed versus developing values before using any overlay in a test. A named “New York” window need not match the US equity opening auction.
Test timing and execution with Quant
Ask Quant to implement the exact symbol, chart interval, session timezone, opening-range window, trigger, order timing, sizing, and exit schedule. In the strategy workflow, review the generated code before running it and configure simulation costs and order settings.
Inspect the trade log around the first eligible entry, final entry cutoff, time exit, and early-close dates. Check losing trades and failed breakouts as well as winners. A candle backtest does not automatically simulate auction participation, queue position, hidden liquidity, or your broker’s rejection rules.
Use earlier history for development and a later untouched period for evaluation. Compare gap fades, gap continuation, and closing setups as separate rule sets. Record the spread or slippage assumptions and test worse fills; higher activity does not guarantee a low-cost execution for your order.
Before the next session
- Confirm the exchange calendar, timezone, and whether the day closes early.
- Record the prior close, relevant levels, and scheduled announcements.
- Define the trigger, stop, target or exit condition, position size, and maximum attempts.
- Set the last permitted fill time and the plan for positions still open near the close.
- Verify whether the order is for continuous trading or a specific auction.
- Afterward, compare actual signals and fills with the plan before adjusting parameters.
A useful open-and-close strategy makes these decisions explicit. The session label provides context; the entry rules, execution assumptions, and observed results determine what the strategy actually does.
Read next