Complex H&S
 By LuxAlgoOct 9, 2026
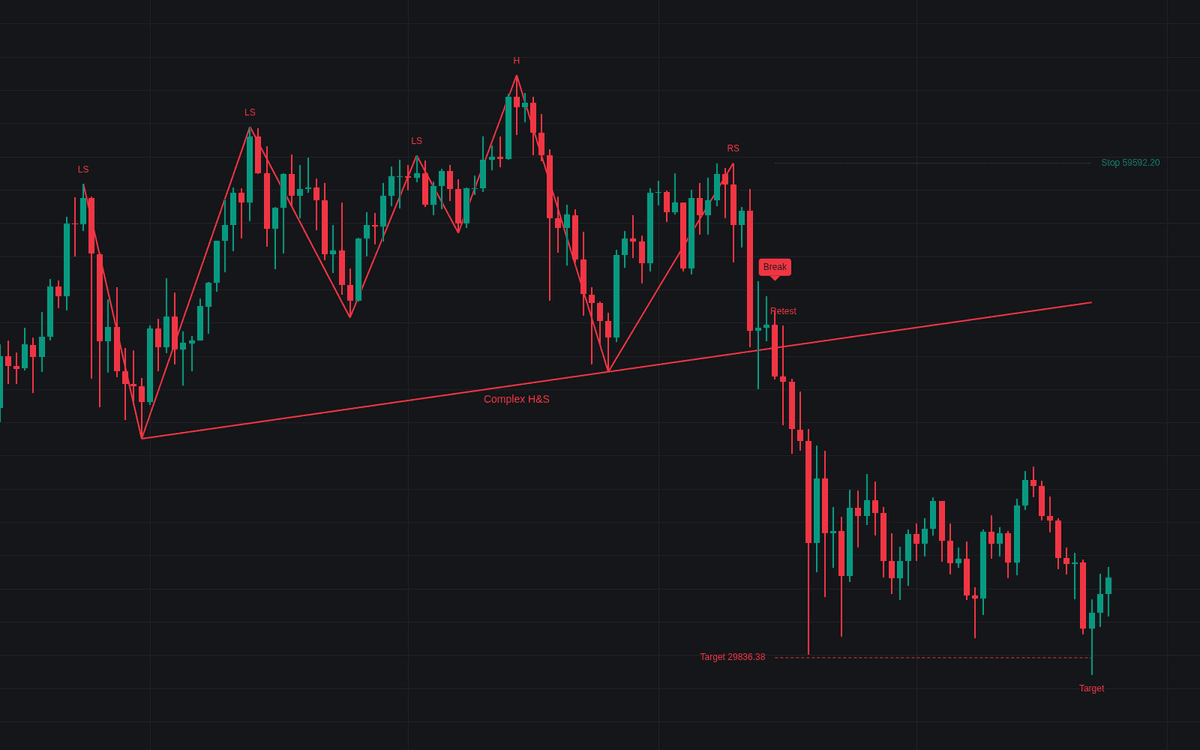

The Complex H&S indicator identifies advanced head and shoulders patterns, offering a more flexible interpretation than traditional variants. By accounting for multiple shoulders or double-head formations, it helps traders capture reversals that standard models often overlook. This tool provides actionable insights by automating pattern detection, visualizing neckline slopes, and calculating target and stop levels based on volatility, allowing for a more systematic approach to technical analysis.
How to Trade the Complex H&S?
The indicator monitors for both top (bearish) and inverse (bullish) head and shoulders patterns. When a pattern is detected but not yet completed, it is considered in the forming phase. Traders should watch for the price to perform a decisive move through the neckline.
Once a breakout occurs, the indicator projects a measured target based on the distance from the head to the neckline, which can serve as a primary exit point. The nearest right shoulder is often utilized as a reference for setting a stop-loss level, as price action violating this area suggests that the momentum of the reversal has failed. You can also look for the "Retest" label, which indicates when the price returns to the broken neckline before continuing in the direction of the breakout, often providing a secondary entry opportunity. If the price reclaims the neckline or exceeds the designated failure threshold, the setup is considered void.
Complex H&S Settings
Pattern Detection
- Swing Length: Defines the number of bars on both sides of a peak or trough required to confirm a swing point, directly affecting the sensitivity of the detection.
- Head Prominence (%): Sets the minimum height the head must maintain above the shoulders to be classified as a valid head-and-shoulders structure rather than a range.
- Minimum Shoulder Height (%): Filters minor price fluctuations near the neckline to ensure identified shoulders meet specific height requirements.
- Double Head Tolerance (%): Determines the allowable vertical deviation between two adjacent peaks to be considered a double head.
- Neckline Tilt Limit (%): Limits the allowable slope of the neckline to exclude overly steep structures that may not function as traditional trend lines.
- Maximum Pattern Length (bars): Restricts the total time span allowed from the first shoulder to the last shoulder of the formation.
- Require Shoulder Symmetry: When enabled, the indicator only identifies patterns with an identical number of shoulders on both the left and right sides.
- ATR Length: The lookback period used for Average True Range calculations, which scales the neckline tolerance and breakout buffers.
Prior Trend
- Require Prior Trend: If enabled, the indicator will only validate patterns that emerged following a clear trend in the preceding price action.
- Prior Trend Window (bars): The lookback duration used to assess the strength of the preceding move.
- Minimum Prior Move (ATR): The minimum required distance the price must have moved in the direction of the trend, measured in ATR multiples, before the pattern began.
Neckline Break
- Decisive Break Buffer (ATR): An extra margin that the closing price must penetrate beyond the neckline to confirm a valid breakout.
- Completion Window (bars): The time limit following the last right shoulder for the neckline break to occur.
- Closes Back for Failure: Specifies the number of consecutive closes on the opposite side of the neckline required to label the pattern as a failure.
- Measured Target: Toggles the visibility of the target level calculated by the classic measure rule.
- Post-Break Watch (bars): Defines how long the indicator tracks target and stop labels after a breakout has occurred.
Style
- Inverse (Bullish), Top (Bearish), Unconfirmed: These inputs allow you to customize the color scheme for bullish, bearish, and pending patterns.
- Event Labels: Toggles the display of annotations for retests, target hits, and failure signals on the chart.
Frequently Asked Questions
Free on Vela
Run it on Vela. Go further with a paid plan.
- Up to 500 strategy alerts, with webhook automation
- Up to 10× the chart history of Free
- Orderflow lookback up to full history
- Up to 100,000 monthly credits for Quant to customize it
- Futures data alongside crypto, stocks, forex and commodities

Run it on Vela. Make it yours with Quant.
Open this indicator free on Vela, our next-generation charting platform. Then ask Quant, our coding agent built into Vela, to retune it or turn it into a backtested strategy of your own.