Head & Shoulders
 By LuxAlgoMay 2, 2026
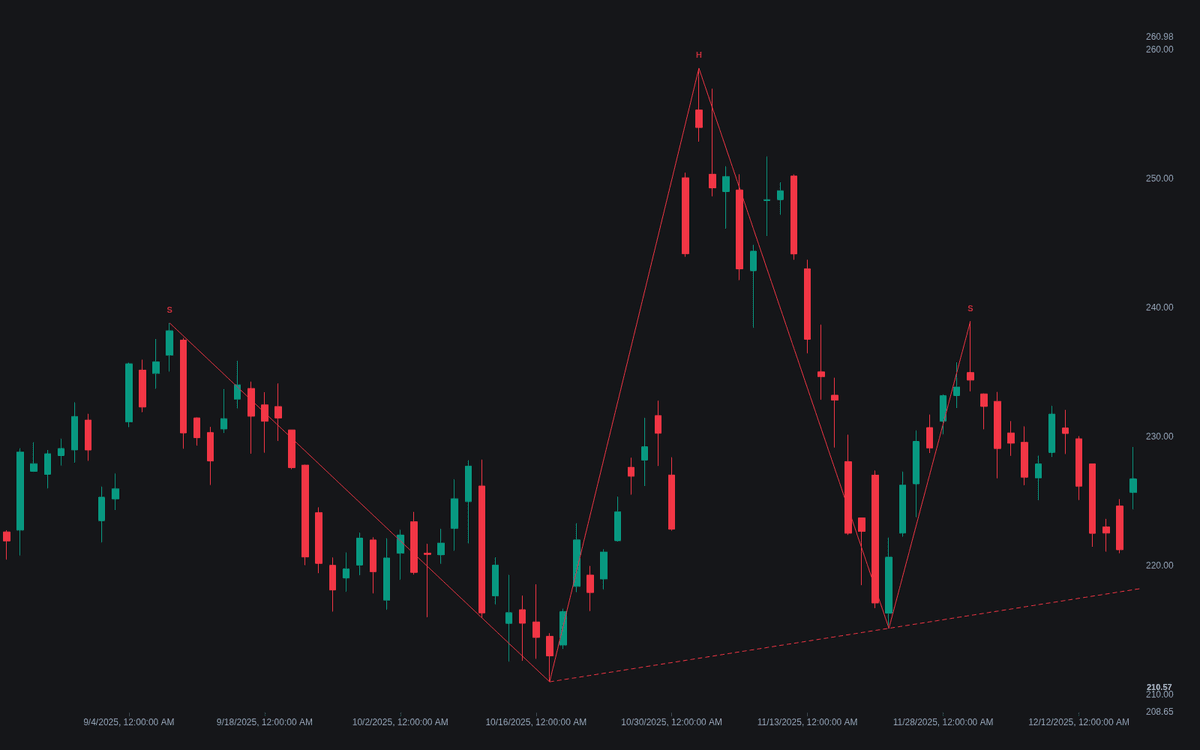

Head & Shoulders is the definitive clean detector for the head and shoulders reversal and its inverse. Candidates must pass explicit geometry (the head the extreme peak, shoulders roughly symmetric in height and duration on the pattern side of the neckline, tilt capped) before the outline and dashed neckline are drawn. Nothing is a signal until price closes through the neckline: the break freezes the line, projects the head-to-neckline height as a measured objective, and tags breaks lacking volume expansion.
How to Trade the Head & Shoulders?
- Pattern Forming alert: the right shoulder just confirmed, a scenario, not yet a trade.
- Neckline break: a decisive close completes the pattern; a Break (low vol) tag flags a move without volume expansion.
- Retest event: the first return to the broken neckline without reclaiming it, the entry many traders prefer over chasing the break.
- Failed label: consecutive closes back through the neckline, or a close beyond the right shoulder, end the trade premise.
Every stage carries its own alert, from forming to objective.
Head & Shoulders Settings
- Swing Length (default 10): bars each side a pivot must dominate; larger finds wider, slower patterns.
- Require Prior Trend (default enabled): only accept patterns reversing an established trend.
- Shoulder Symmetry Tolerance % (default 50): maximum shoulder height and leg-duration asymmetry.
- Neckline Tilt Limit % (default 50): maximum neckline drift as a share of pattern height.
- Completion Window (Bars) (default 100): bars allowed for the neckline close-through.
- Reclaim Bars For Failure (default 2): closes back through the neckline that declare a failed break.
- Flag Low Volume Breaks (default enabled): compare break volume against its 20-bar average.
- Style toggles: outline, S/H/S labels, measured objective and event labels, all on.
Frequently Asked Questions

Original indicatorBuilt in-house by LuxAlgo
The Library is free. Quant makes it yours.
Pull any concept or indicator into Quant: rebuild it, retune it, or turn it into a backtested strategy of your own.