24-Hour Volume Indicator: Measuring Daily Activity
A 24-hour volume measure describes activity within a moving 24-hour window. Check its units: traded quantity, currency turnover, and trade count are different measures. TradingView’s named 24-hour Volume indicator displays currency volume, while another platform’s “24h volume” field may use a different convention.
Start with price and volume on LuxAlgo’s native charts, then use Quant to help build and test an explicit activity-based rule. A large volume number does not by itself prove a breakout, identify institutional trading, or establish that an order can be filled cheaply.
How the 24-Hour Volume Indicator Works
Rolling Time versus a Trading Day
At 3:30 p.m. on Wednesday, a rolling 24-hour measure looks back 24 elapsed hours. A daily or session measure follows its defined boundary instead. Daily volume is not inherently limited to U.S. regular hours: the instrument, feed, chart session, and provider determine its coverage.
A rolling window does not recover missing transactions or automatically include premarket and after-hours data. On a market that closes for a weekend, the preceding 24 calendar hours may contain little or no trading. That is different from summing the most recent 24 hours in which the market was open.
Quantity, Turnover, and Trade Count
| Measure | Calculation concept | Example units |
|---|---|---|
| Traded quantity | Sum quantities in the chosen window | Shares, contracts, or base-asset units |
| Trade-level turnover | Sum each execution’s quantity × its price | Quote currency, subject to the instrument’s conventions |
| Estimated currency volume | Convert reported quantity using a specified price source | Selected currency; may differ from exact executed turnover |
| Trade count | Count executions | Number of trades, regardless of their sizes |
For a hypothetical two-trade example, 100 shares at $10 and 200 shares at $11 total 300 shares and $3,200 of executed turnover. Multiplying all 300 shares by the latest $11 price gives $3,300, a different estimate. “Number of trades × price” would omit trade size altogether.
Contracts and currency conversions need their own conventions. Do not multiply volume that is already reported in quote currency by price again. A dollar sign also does not make two feeds comparable if they cover different venues or products.
TradingView’s Built-in Calculation
TradingView documents a sum based on lower-timeframe bars that opened within the preceding 24 calendar hours. Its calculation interval varies with the chart interval. The indicator can convert base volume using the selected Price Source and display a chosen Target Currency.
These settings matter when comparing values with an exchange’s turnover field. A bar-based conversion is not automatically identical to summing every execution’s notional value. The official introduction identifies the built-in indicator and explains that its Pine Script® source can be inspected.
Read the Units and Timestamp
K, M, and B commonly abbreviate thousands, millions, and billions. For example, $1.50B means $1.5 billion in the stated currency. Currency symbols, decimal separators, clock formats, time zones, and refresh rates depend on the platform and feed; there is no universal stock or forex update schedule.
Check whether data is delayed and whether the displayed value includes an unfinished bar. Document the time zone and elapsed-time convention, particularly around daylight-saving changes. Currency conversion also has a rate source and timestamp; do not assume every display uses an instantaneous exchange rate.
What Volume Can Tell You about Market Activity
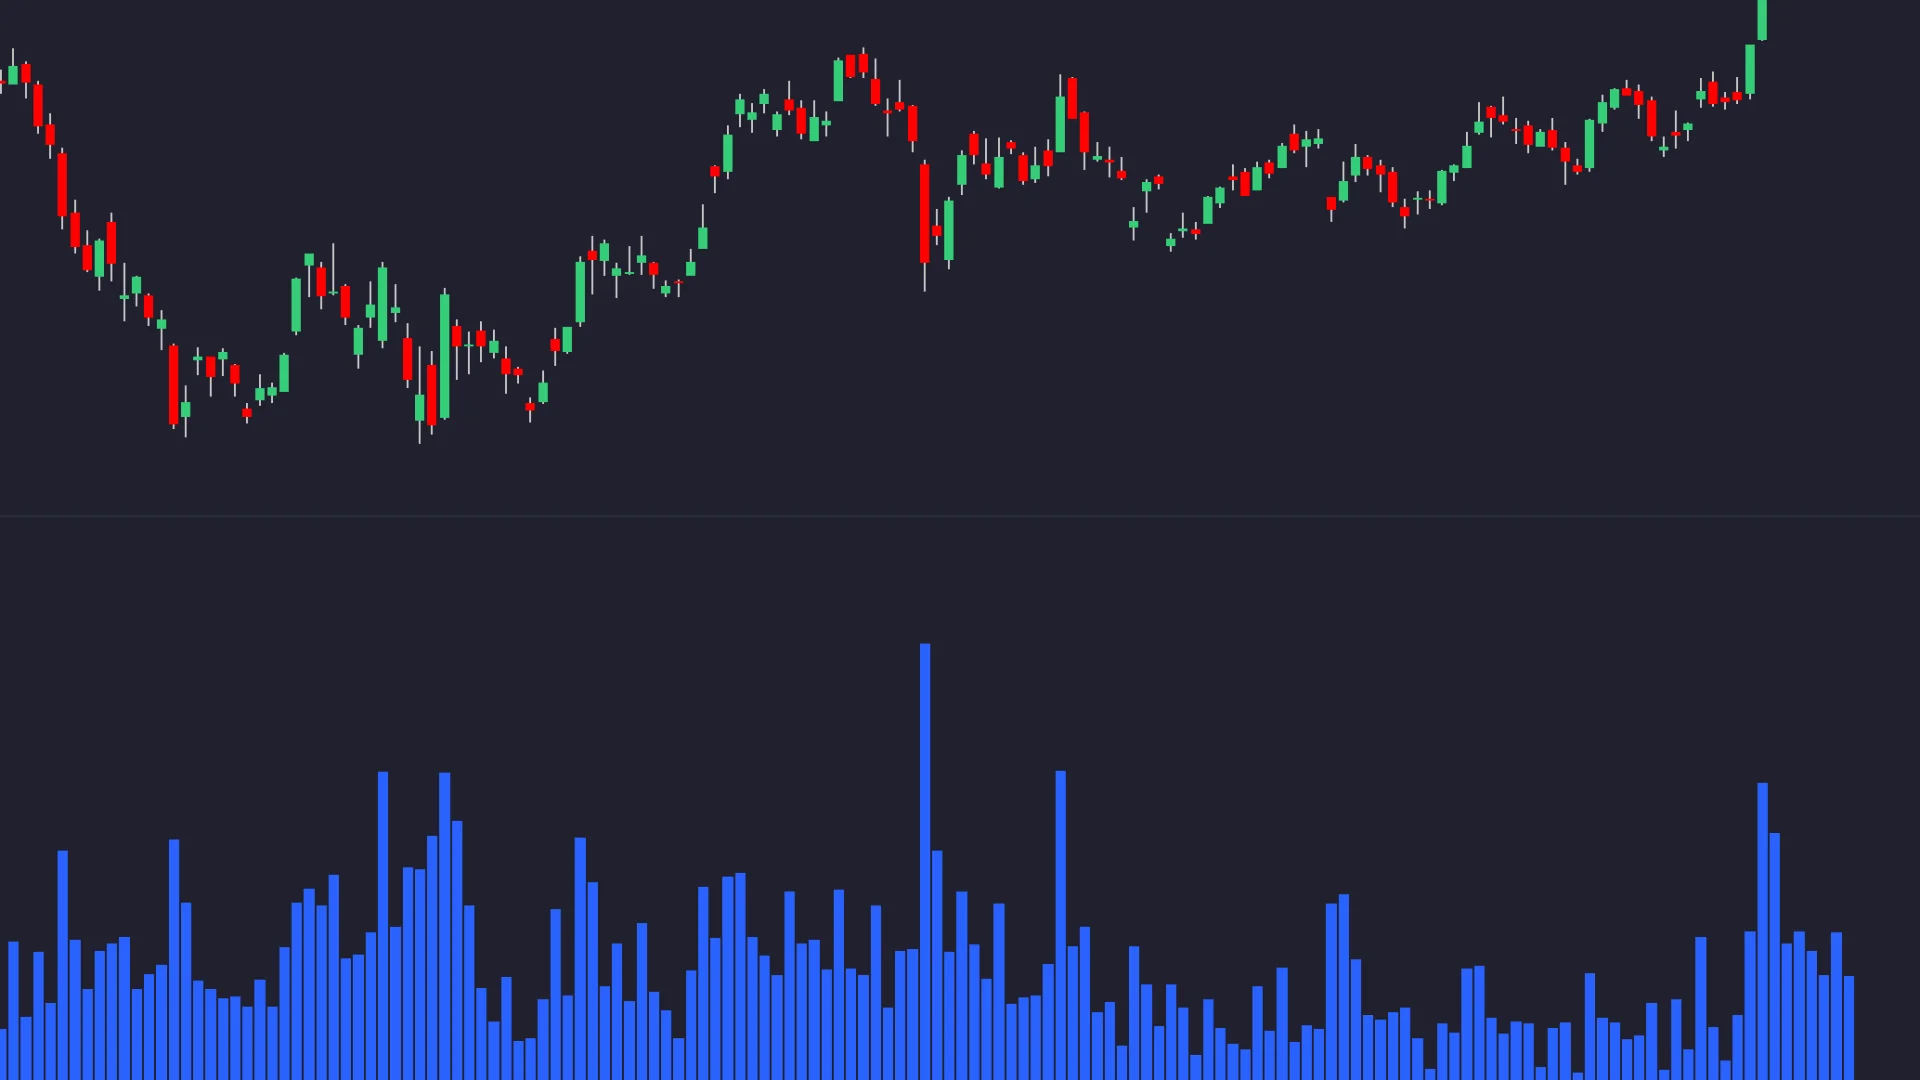
Higher volume means more reported activity under the selected definition. It does not identify the participants or their motives. Every execution has both a buyer and seller, so total 24-hour volume is not “buying volume” in an uptrend or “selling volume” in a downtrend.
A price increase on elevated volume may be worth investigating alongside a predefined setup. A rise on lower volume can also persist. Treat volume confirmation as a condition to evaluate rather than proof that a move is legitimate.
Liquidity Requires More than Volume
Past turnover is different from the liquidity available when an order arrives. Check spread, available depth where supported, order size, volatility, and expected slippage. A highly active market can still have wide spreads or poor fills during a fast move.
Similarly, a quiet period does not establish that a volatility expansion must follow. A volume spike can occur during continuation, exhaustion, news reactions, or forced transactions; the spike alone does not distinguish them.
VWAP provides a volume-weighted price reference. An execution algorithm may use a VWAP benchmark, but adding a VWAP indicator to a chart does not automatically split orders or improve their fills.
Use a Comparable Baseline
Compare the same instrument, venue coverage, volume units, and session settings. A rolling value observed every minute shares most of its data with the preceding value. Those observations are not independent samples, and a large old bar leaving the window can lower the total without any new selling.
For example, hypothetical currency volume of $150 million versus a comparable $100 million baseline is 1.5 times the baseline, or 50% higher. It is not a 150% increase. Define whether the baseline consists of daily observations at the same time, completed sessions, or another consistent sample.
Early-session cumulative activity should not be compared uncritically with a complete day. Relative Volume at Time explains time-matched comparisons. RVOL and rolling 24-hour volume answer different questions, and an unfinished period can distort either comparison.
- Stocks: confirm the included venues and regular or extended sessions.
- Crypto: identify the exchange and pair. Venue-specific trading volume is not total global volume or on-chain transfer volume.
- Spot forex: tick counts may be an activity proxy rather than centralized traded quantity.
- Indexes and derivatives: identify any proxy and the contract conventions; a calculated index does not necessarily have directly traded volume.
Build a Testable Volume Strategy
Breakouts and Reversal Candidates
Define the price setup before adding volume: for example, a completed close beyond resistance marked in advance. Specify the activity threshold, baseline, entry time, and invalidation. Compare the strategy with and without its volume condition.
If price makes a new high while volume weakens, record it as a potential divergence. It is not proof of quiet institutional distribution. Sideways price and rising activity likewise do not establish accumulation by informed traders. A climax with a wide price range needs a subsequent price rule before it becomes a trade.
If swing confirmation requires later bars, use the time when confirmation becomes available. A 24-hour total also mixes activity from earlier periods, so it may conceal the volume associated with the specific breakout bar. Inspect that bar separately when the strategy requires it.
Execution and Position Risk
Do not enlarge a position solely because 24-hour volume is high. Size from the planned stop distance, costs, account risk budget, and instrument value, then check whether execution conditions support that size.
For a hypothetical share entry at $30 with a $28.50 stop, $150 risk budget, and $0.10 per-share cost allowance, size is floor($150 ÷ $1.60) = 93 shares, or $148.80 of planned risk. Gaps and slippage can produce a larger loss. Apply appropriate contract values for other instruments, following position-sizing principles.
Analyze and Test with LuxAlgo
Use Native Charts for Price Context
LuxAlgo’s native volume profiles show how volume is distributed by price. This provides a different view from a total over time. Session and Rolling profiles require footprint data; the Visible Range profile uses candle volume and changes with the visible range.

Check symbol and data availability before choosing a calculation. Use the profile for location and a separately defined time-based measure for activity; one does not replace the other.
Create the Rule with Quant
- Describe the window. Specify 24 elapsed hours, included sessions, timestamp boundaries, and missing-data behavior. A fixed number of chart bars is not always equivalent.
- Describe the units. Choose raw quantity or a defined currency-volume calculation, including price source and any conversion.
- Describe the trade. Give Quant the price trigger, baseline, threshold, entry timing, stop, exit, and sizing rule.
- Review and run. Inspect the generated code and compare a small sample with a hand calculation. Identify any approximation when required lower-timeframe data is unavailable.
- Validate. Set commission and slippage in strategy properties, review individual trades and drawdown, and reserve later data that was not used to select settings.
A successful run does not prove that the implementation matches another platform or that its results will persist. Keep the baseline and validation window fixed when comparing alternatives.
Video: Compare Volume at Equivalent Times
This Trade Nation tutorial with TradingView explains a related volume-comparison tool. It is useful for choosing a comparable baseline, but Relative Volume at Time is not the same calculation as rolling 24-hour volume.
FAQs
What makes the 24-hour volume indicator different from traditional daily volume measurements in market analysis?
A rolling measure uses the preceding 24 elapsed hours, while daily or session volume follows a defined boundary. Neither label guarantees complete venue or extended-hours coverage. Check the feed, sessions, units, and calculation before comparing values.
What makes LuxAlgo's volume analysis better than analyzing volume manually?
Native charts make price and volume relationships easier to inspect, while Quant can help implement a specified strategy for testing. These tools can make the workflow more repeatable, but do not automatically eliminate errors or improve returns. Review the data, generated code, costs, and sample trades.
How can traders use the 24-hour volume indicator to spot potential market trend reversals?
Compare activity with price behavior and a consistent historical baseline, then define the price confirmation and invalidation needed for a trade. A divergence or spike is a candidate condition, not proof of a reversal, accumulation, or distribution. Test it on later data and account for execution costs.
Read next