Liquidity Zones vs. Order Blocks: Key Differences
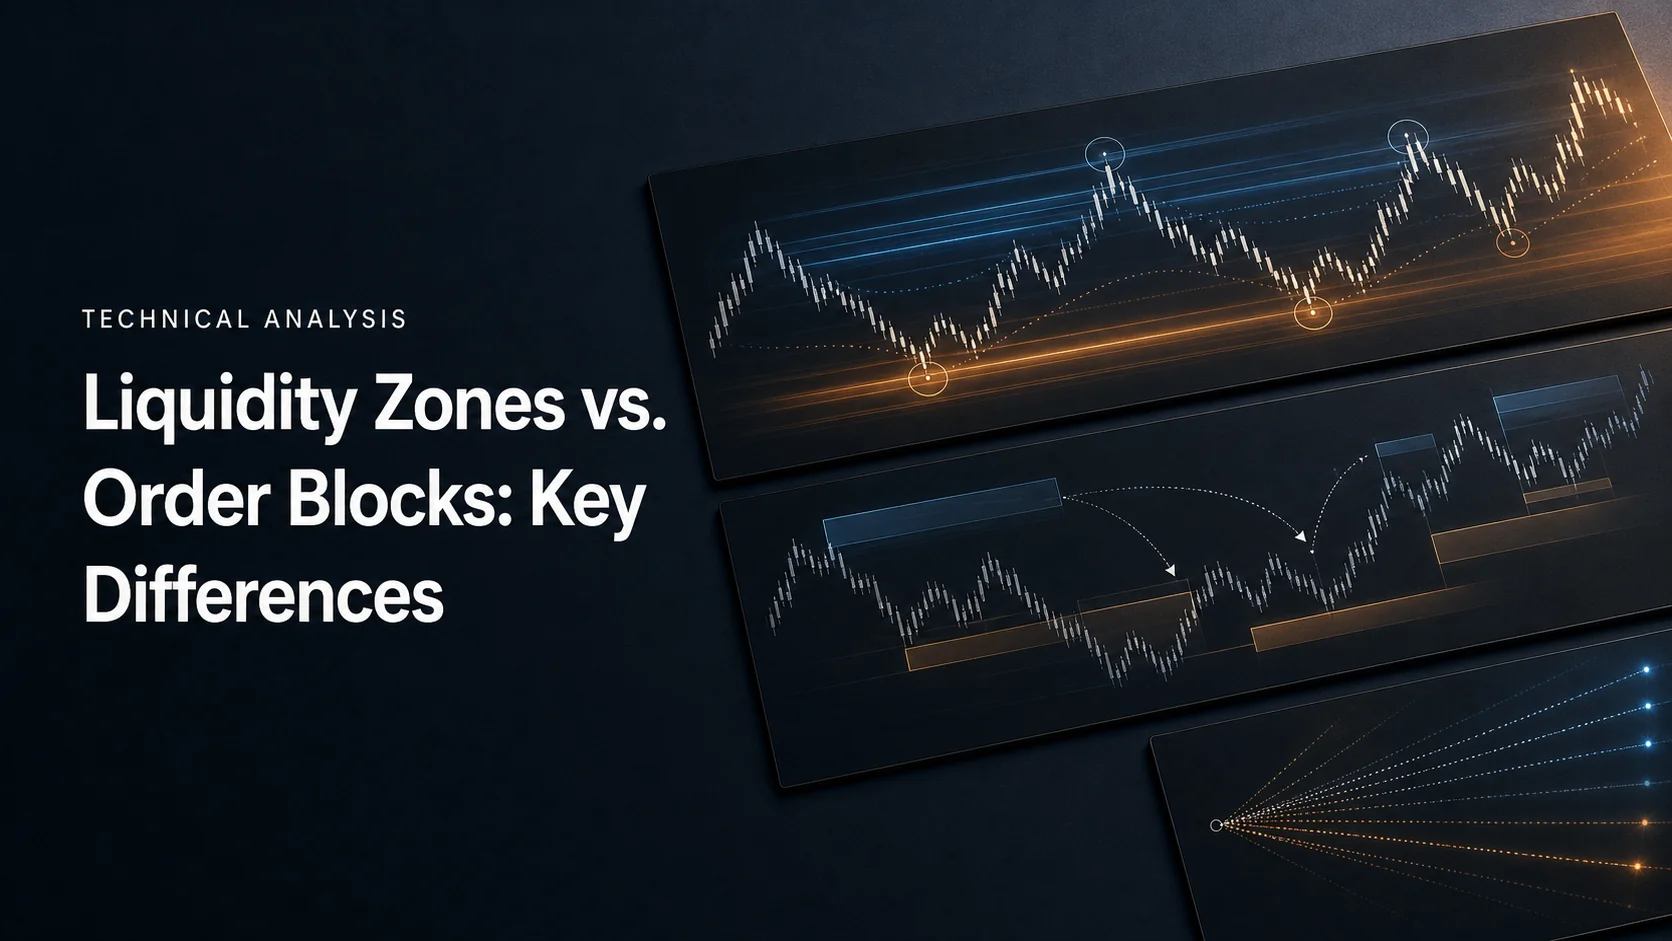
A liquidity zone marks an area where a trader expects concentrated trading interest; an order block marks a price region selected by a particular price-action rule. They can overlap, but neither label proves that an institution has orders waiting there. The practical difference is how you define each area, when it becomes observable, and what you require price to do before a trade.
Use native LuxAlgo charts to study the underlying price behavior and Quant, our coding agent, to help turn explicit rules into supported indicators or strategies. The Library’s order-block and liquidity tools add automatic chart annotations on a Quant Chart. Keep the actual tool and its detection settings clear when comparing examples.
Liquidity zones and order blocks compared
| Question | Liquidity zone | Order block |
|---|---|---|
| What is being marked? | A candidate area of concentrated interest, often inferred around repeated highs/lows, a range boundary or a chosen volume region. | A region defined by a price-action method, often associated with a move away from a prior candle or swing area. |
| What evidence is available? | Price reactions, traded volume or displayed depth, depending on the data used. These are different observations. | Historical candles and the indicator’s detection criteria; some methods also use volume. |
| What is its role? | Context, a possible reaction area or a potential destination for price. | A candidate entry, invalidation or support/resistance region under stated rules. |
| Must it be wider or more accurate? | No. Width depends on the construction method. | No. A narrow rectangle does not establish better accuracy or a safer stop. |
| Does it identify institutional orders? | A chart-based inference cannot identify all waiting orders or their owners. | A pattern does not disclose who traded or whether unfilled orders remain. |
Market liquidity is the ability to trade with limited price impact. A chart zone is an analytical representation, not a complete measurement of that ability. Executed volume records trades that occurred; displayed order-book depth records visible resting interest at a venue and time. Stops, hidden interest and later cancellations may not be visible in that snapshot. Keep those distinctions when using the word liquidity.
How to identify a liquidity candidate
Repeated highs or lows, range edges, long wicks and consolidation can give you locations to investigate. They do not establish a known count of stops. A volume spike can show activity at a test, but does not reveal the identity or intention of each participant. A zone may produce a reversal, a pause or a continuation through it.
- Choose a reproducible reference: for example, two confirmed swing highs within a specified price tolerance, or the high and low of a completed session. Record the timeframe and session definition.
- State how the zone is drawn. Two highs at 110.00 and 110.10 with a 0.15 tolerance satisfy that example rule; you might mark 110.00–110.10, rather than redraw the band after seeing the result.
- Define the event separately. A high above 110.10 followed by a completed close below 110.00 is one possible rejection rule. A close above the zone is a different event, not the same setup.
- Track whether the level was already known. A pivot requiring three subsequent bars cannot be used at the pivot bar itself.
Equal highs/lows require swing confirmation and are displayed retrospectively; liquidity trendlines also appear retrospectively once their conditions are met. Historical annotations can therefore appear earlier on a chart than the time a trader could first have acted on them.
Define the order block before evaluating it
Order-block definitions vary. One common price-action convention selects the last opposite-direction candle before a qualifying move and structure break. Other algorithms use swing and volume rules. A bullish block is usually treated as potential support; a bearish block as potential resistance. State whether its boundaries use the whole candle, the body or another range.
A prior sweep, an imbalance and an untouched zone may be filters in a particular strategy; they are not universal requirements shared by every order-block indicator. An imbalance does not prove institutional accumulation, and a previously tested block is not automatically useless. Test first-touch and later-touch approaches separately instead of changing the definition after a loss.
What order-block metrics and mitigation mean
Volumetric order-block tools in the Library, such as the Order Block Detector, expose settings such as a swing lookback length, volume metrics and mitigation methods. In such tools a block’s volume percentage is typically its share of accumulated volume across the displayed blocks. It is not a probability that price will respect the zone, a share of all institutional orders, or a forecast of outcomes.
Mitigation is also method-specific. A tool can remove a block when price crosses its relevant boundary using a close or wick rule, or when it crosses the average level under that setting. A wick through a bullish block followed by a close back inside can therefore be treated differently by different settings. Select the method in advance. A rectangle disappearing from the chart is not evidence that every underlying order was filled.
Some tools display mitigated blocks as breaker blocks when enabled. Multi-timeframe data retrieval can also affect placement and when mitigation is reflected. Do not assume a block drawn on a lower-timeframe chart was available at the beginning of its higher-timeframe source candle.
Use both concepts in a defined setup
Combining a zone with a block gives you more conditions to test, not an automatic improvement in results. Use a fixed higher-timeframe context and a separately defined lower-timeframe trigger. Conflicting timeframes are a reason to clarify the rule or skip a setup, rather than choose whichever chart supports the trade you want.
| Step | Illustrative bullish setup | Bearish counterpart |
|---|---|---|
| Context | A previously recorded low or range boundary is tested. | A previously recorded high or range boundary is tested. |
| Reaction | Price trades below the reference then closes back above it. | Price trades above the reference then closes back below it. |
| Structure condition | A completed close breaks a previously confirmed swing high. | A completed close breaks a previously confirmed swing low. |
| Candidate block | Under a declared candle rule, mark the chosen bearish candle before that qualifying move. | Under the corresponding rule, mark the chosen bullish candle before the qualifying decline. |
| Entry and invalidation | Wait for the specified retest or enter under a separate breakout rule; define a stop below the chosen boundary. | Use the specified retest or separate breakout rule; define a stop above the chosen boundary. |
For a concrete bullish illustration, suppose the prior low is 100. A completed bar trades to 99 and closes at 101, satisfying the chosen reclaim rule. Only after a later completed close breaks a known swing high at 104 does the example method mark its qualifying candle range at 100–102. The zone becomes actionable then, not retroactively at the candle’s origin.
One retest rule could require a later bar to overlap 100–102 and close above 102, with entry at the next available opening price. Cancel if price closes below 100 before that trigger or if ten completed bars pass without it. A limit order at 102 is a different strategy with different fill assumptions. If price never returns, there is no retest trade. These numbers illustrate how to specify a rule; they are not recommended parameters.
Size the position from risk, not confidence
For a fixed risk budget, a wider stop requires a smaller position. Suppose the risk budget is $200, with $20 reserved for estimated costs. At an actual entry of 102 and a planned stop at 99, price risk is $3 per share: floor(($200 − $20) / $3) = 60 shares, or $6,120 notional. With a wider stop at 96, the same calculation gives 30 shares. More overlapping signals do not justify ignoring that arithmetic.
For the 60-share example, a target at 108 offers $360 gross reward against $180 planned price risk, or 2R before costs. A gap exit at 95 instead loses $420 before costs. Recalculate from the actual entry, check available capital and instrument multiplier, and account for correlated positions. A stop order does not guarantee its stated price.
Partial exits and trailing stops change the payoff distribution. If half the 60 shares exit at 105 and the rest at 108, gross profit is $90 + $180 = $270, or 1.5R against the initial $180 price risk. A trailing rule needs an explicit update time and a rule preventing a long stop from moving downward. Compare those exits with the original fixed target; do not assume they always maximize gains.
Research the rules in native LuxAlgo
Start with a simple version that can be reproduced from the available data. Ask Quant to build a supported native strategy specifying the pivot confirmation delay, zone boundaries, completed-bar reclaim, structure break, retest expiry, entry timing and exits. Inspect the generated code, then run it manually. Check individual trades against the chart before interpreting aggregate results.
- Use only data known at each decision. A backdated swing marker, later-discovered block or final higher-timeframe candle must not leak into an earlier signal.
- Review strategy Inputs and Properties, including capital, order size, commission, slippage and margin where relevant. State what happens if both stop and target fall within one bar.
- Compare liquidity-only, block-only and combined rules with the same sample and costs. Hold out dates and test across different volatility conditions; fewer trades can make an apparently better result less reliable.
- Treat price-and-volume algorithms as proxies. A custom approximation is not necessarily a Library tool’s algorithm, and an underlying chart cannot reconstruct an unavailable historical order book.
Strategy Alerts are a separate alert feature; an alert or generated script is not proof of an executed broker order. Use the native data documentation to understand the symbol and venue behind the chart and volume.
Video: liquidity concepts explained
The following lesson illustrates common chart-based liquidity concepts. Interpret the diagrams as a framework for price behavior, alongside the data and timing limitations above.
Common problems to control
- False breaks: distinguish a brief excursion and reclaim from a completed break; neither outcome guarantees what happens next.
- News and gaps: events can invalidate a level and produce fills beyond a planned stop. Include event rules before testing.
- Ambiguous boundaries: keep a consistent candle/body range and mitigation setting. Retrospective redrawing hides failed candidates.
- Overlapping conditions: several indicators derived from the same candles are not independent confirmations.
- Missing volume: volumetric block metrics require volume data. Missing or venue-specific volume cannot be treated as a complete market measure.
Frequently asked questions
Are liquidity zones and order blocks the same?
No. A liquidity zone is a candidate area of concentrated interest; an order block is a region selected by a particular price-action method. Their boundaries can overlap, but their definitions and uses differ.
Do order blocks prove institutional activity?
No. Price and volume patterns do not reveal every participant’s identity, intent or remaining orders. Treat the zone as an analytical hypothesis.
Must a valid block have a liquidity sweep first?
Only if your chosen method requires it. A sweep, imbalance and first-touch filter are strategy conditions, not universal rules for all order-block tools.
What does an order-block volume percentage mean?
It represents the block’s share of accumulated volume across the displayed blocks. It is not a win probability or a measure of all institutional orders.
Should I increase size when the stop is wider?
No. For the same risk budget and cost allowance, a wider entry-to-stop distance requires a smaller position. Actual losses may still exceed planned risk because of gaps and execution costs.
How can I test the combined setup in LuxAlgo?
Specify causal detection, entry, invalidation and exit rules. Ask Quant for a supported native strategy, inspect the code and run it manually. Compare with simpler baselines and account for confirmation delays, costs and unseen test periods.
References
- LuxAlgo — Native charts and chart data; native workflow and data scope.
- LuxAlgo — Quant strategies and native strategy settings; code review, execution and research assumptions.
Read next