Range Bar Charts: Key Concepts for Smart Traders
Range bars organize a chart by a chosen amount of price movement rather than a fixed amount of elapsed time. They can make price structure easier to inspect, but a cleaner picture does not guarantee better signals. The range setting, data resolution, gap handling and execution assumptions all affect what you see and what you can realistically test.
Use native LuxAlgo charts to establish price context and research a supported strategy with Quant, our coding agent. For a range-bar study, first verify that the chosen charting platform supports the exact construction you need. LuxAlgo’s current native chart documentation does not list Range as a chart type; a price-movement script on time bars should not be presented as a verified tick-built range chart.
Range bars versus time-based charts
| Question | Range bars | Time-based bars |
|---|---|---|
| What determines a new bar? | A configured price-movement rule. | A specified clock interval, subject to market sessions and available data. |
| How much time does each bar cover? | Variable: seconds, minutes or much longer. | A defined interval, such as five minutes. |
| What happens during quiet trading? | Fewer bars may complete if price stays within the chosen range. | New intervals continue during the session, even when price movement is small. |
| What does an indicator period mean? | A number of price-event bars with variable elapsed duration. | A number of fixed-time bars. |
| What are the main limitations? | Construction differences, incomplete bars, virtual gap bars and synthetic-fill assumptions. | Intrabar path is still hidden in OHLC data; fixed spacing can obscure differences in activity. |
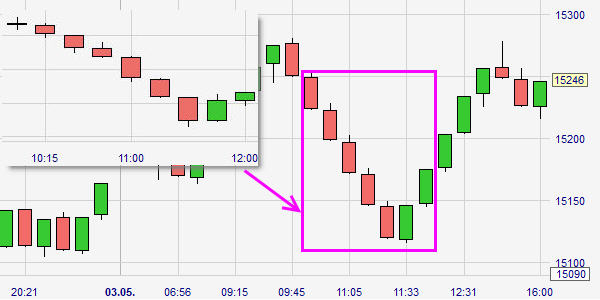
Neither chart preserves every detail of the trade sequence in its visible bars. Time charts summarize observations within intervals; range charts summarize observations according to a price rule. Keep timestamps and the underlying data available when studying news, session boundaries, holding time or order execution.
How range bars are constructed
A range setting defines the price span used by the chart’s construction algorithm. A currently forming bar can remain incomplete until the relevant condition is met. It may update many times before another bar appears. A bar taking five seconds and one taking twenty minutes can occupy the same horizontal width.
Platform rules matter. Common range-bar conventions constrain a completed bar’s high-to-low span and place its close at an extreme, but do not assume every implementation uses identical opening, closing, reversal or session-reset rules. A gap can also cross several nominal ranges without trades occurring at every intermediate price.
Ticks, points and range settings
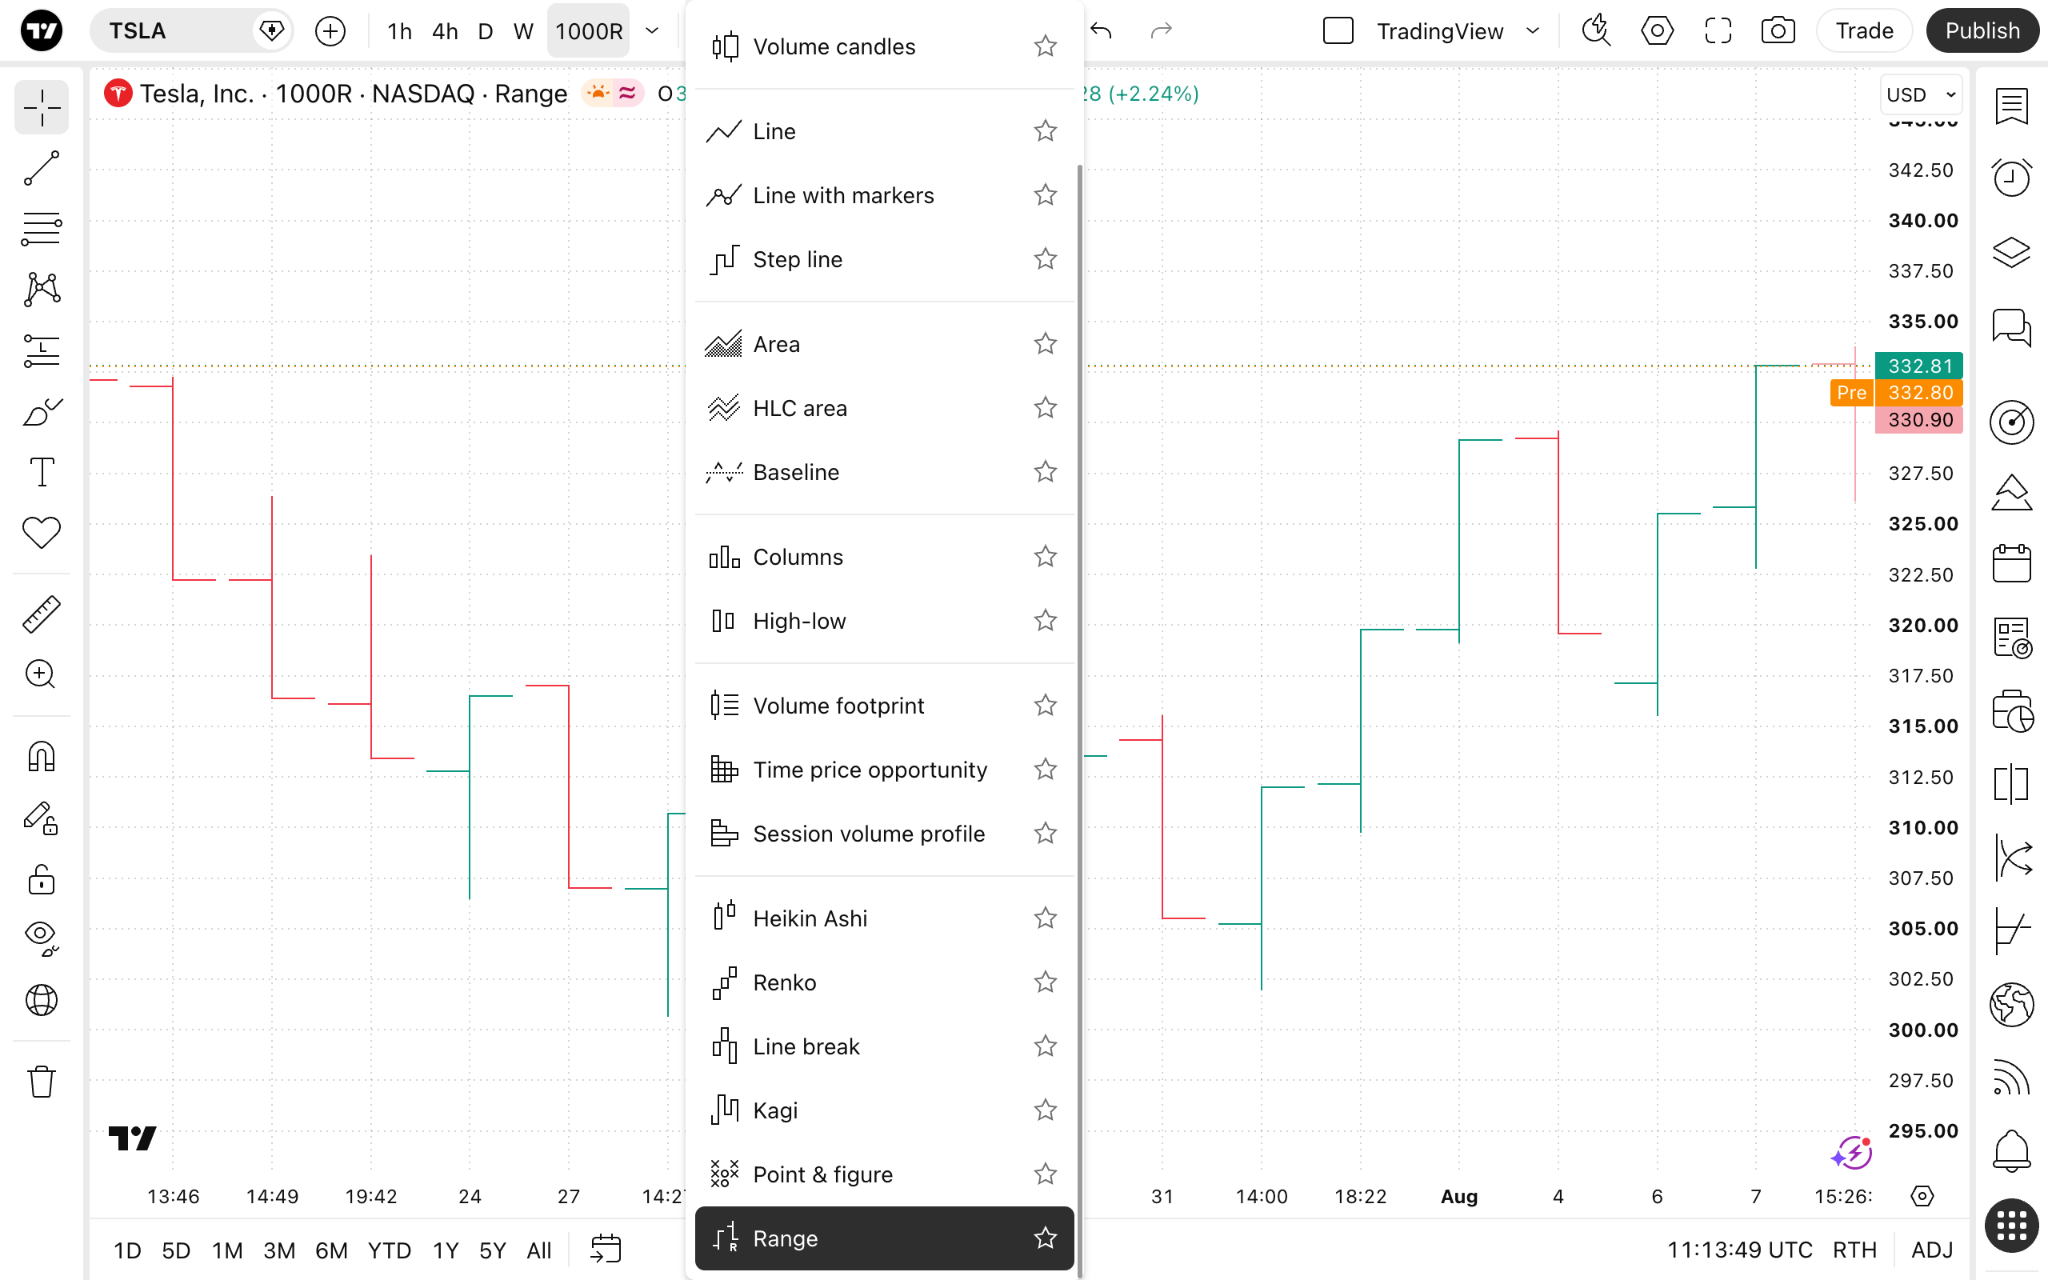
In TradingView’s range-chart documentation, one range unit equals one minimum price change, or tick. If an instrument’s minimum tick is 0.25, a 10-range setting corresponds to 2.50 price units: 10 × 0.25. For an instrument with a 0.01 tick, the same numeric setting corresponds to 0.10. A setting labeled “10” is therefore not necessarily ten currency units or ten index points.
Check the symbol’s minimum increment and the platform’s units before copying a setting from another instrument. For a hypothetical $0.50 range on a symbol with a $0.01 tick, the corresponding tick count is 50. The precise sequence of completed bars still depends on the implementation and the underlying price path.
Projection and phantom bars
TradingView distinguishes projection bars, built from the currently forming bar, from phantom bars, virtual bars that fill untraded price gaps. A projection is not a completed historical signal. A phantom bar is not evidence that a trade could have filled at its displayed price, and it is not a momentum indicator.
For example, if the last observed trade is 100 and the next is 103, a display may bridge intermediate prices according to its gap setting. That does not establish trades at 101 or 102. A backtest must not quietly convert those visual steps into executable fills.
Choose a range size you can test consistently
Smaller ranges generally produce more bars and more sensitive signals; larger ranges aggregate more movement into each bar. Neither automatically suits a specific holding period. Compare the range with the instrument’s tick size, spread, typical movement and the strategy’s intended decision frequency.
- Start with explicit units: document the symbol, venue, tick size, range value and session settings.
- Use a separate volatility reference: if using ATR to select the range, calculate it on a stated time-based series rather than assuming range-bar ATR has the same meaning.
- Freeze the rule: keep the range unchanged within a test segment, or specify exactly when an adaptive value updates.
- Include trading costs: a very small range can be economically insignificant relative to spread, commission and slippage.
A percentage of daily ATR can be a research starting point, not a universal optimum. If the prior completed daily ATR is $4.00, trial settings of 10% and 20% give $0.40 and $0.80. With a $0.05 tick, these are 8 and 16 ticks. Compare them on the same dates; do not select the better historical result and describe it as a general rule.
For an adaptive approach, an example is to calculate the setting from the previous completed day and apply it at the next session’s start. Record how the platform treats an unfinished bar during that change. Rebuilding old bars with a volatility value learned later would introduce information that was unavailable at the time.
What range bars can and cannot improve
Visual compression
Quiet periods may occupy less horizontal space because fewer bars complete. That can make sustained price moves easier to scan. However, repeated oscillation across the chosen threshold can still produce many bars in a sideways market. “Less clutter” is a visual property, not proof that false signals have disappeared.
Support, resistance and trendlines
Repeated reactions can help you mark a price area, but switching chart types does not make that level objectively more accurate. Use consistent swing rules and keep failed tests in your review. A horizontal level describes a price; a sloping trendline also depends on the horizontal coordinate. Its angle on evenly spaced range bars cannot be interpreted as the same price-per-minute slope as on a time chart.
Market activity
With the range setting unchanged, more completed bars per minute can indicate more price movement through the threshold. That is not the same as traded volume or liquidity. It also does not mean the range size itself is adapting: the bar arrival rate changes while the configured price threshold can remain fixed.
Using technical indicators on range bars
Moving averages, RSI, MACD and Bollinger Bands use the input series supplied by the chart. Their interpretation changes when that series is event-based. A 20-bar moving average covers twenty range bars, not twenty minutes. A 14-period RSI can span very different amounts of clock time as activity changes.
An indicator that appears faster on range bars has not necessarily become more predictive. It may simply receive more completed observations during active periods. Compare rules by timestamps and market exposure, not by assuming equal bar counts represent equal horizons. Momentum divergence can also require later swing confirmation; a marker drawn on an earlier pivot was not necessarily available then.
If you add a volatility band, trend filter or support/resistance tool, first check that the script supports the selected chart type. Native LuxAlgo indicators and the TradingView toolkits are separate implementations. Price Action Concepts, Signals & Overlays and Oscillator Matrix should not be described collectively as free indicators, and a screener or alert should not be assumed to scan range intervals merely because an on-chart study plots there.
Turn a visual idea into an entry and exit rule
A bullish-looking bar is not itself a universal entry signal. One testable example is to freeze a resistance level at 100.00, wait for a completed range-bar close above it, and submit an order at the next available tradable price. A later retest entry is a separate method and needs an expiry rule. Define whether repeated closes above the level permit additional entries.
Record the bar-completion timestamp, the first eligible order time and the actual assumed fill. Do not enter at a projected close or at a phantom price inside a gap. Choose a stop based on the setup’s invalidation rule, then calculate quantity from that distance; a one-bar stop is not automatically appropriate for every instrument or range setting.
Position sizing example
Suppose a hypothetical $20,000 account uses a chosen $200 total risk budget and reserves $20 for estimated costs. Entry at $100.50 and stop at $99.00 create $1.50 of price risk per share, allowing 120 shares from the remaining $180: $180 ÷ $1.50. Position value is $12,060, which is different from the risk budget.
A target at $103.50 offers $360 gross, or 2R relative to the $180 price risk. If a gap instead produces an exit at $97.50, the loss is $360 before costs. A stop level does not guarantee its fill. If the planned stop distance doubles to $3.00, the same price-risk budget permits only 60 shares. Apply contract multipliers and minimum lot sizes where relevant.
Testing range-bar strategies realistically
Accurate reconstruction requires enough information about the price sequence. A five-minute bar with open 100, high 103, low 99 and close 102 does not tell you whether 103 or 99 came first. Those paths can produce different range bars, entries and exits. A synthetic reconstruction from coarse OHLC data must be identified as an approximation.
TradingView’s strategy documentation warns that backtests on non-standard charts, including range charts, can use synthetic prices and produce unrealistic results. It recommends standard chart types for testing. The documented standard-OHLC fill option for Heikin Ashi is not a general fix for every non-standard chart.
- Validate construction: compare historical and live/replay bars using the same symbol, feed, settings and available detail. Check session starts, gaps and unfinished bars.
- Validate execution: use actual tradable prices and causal order timing; include spread, commission, slippage and ambiguous intrabar outcomes.
- Compare fairly: use identical dates and costs for the range method and a time-based baseline. Equal bar counts are not equal elapsed test periods.
- Hold out data: choose settings on one period and evaluate them on another. Include trending and sideways conditions rather than only attractive examples.
- Read several metrics: inspect trade count, average result after costs, drawdown, profit factor and time in the market. Calculate duration in clock time, and do not annualize per-range-bar returns as if bars arrived at a fixed frequency.
Software choices and the native LuxAlgo workflow
Research a supported baseline in LuxAlgo
Ask Quant to build a supported native strategy with explicit entries, stops, targets and position sizing. Inspect the generated code, then run it manually. Review strategy Inputs and Properties and chart-level examples before interpreting aggregate performance.
A time-based breakout strategy can be a useful comparison for a range-bar hypothesis, but it is a different strategy representation. Do not claim that a generated script reproduces a vendor’s range bars unless its data, construction and timing have been verified. The native chart types listed in the current documentation include candles, bars, line, area, baseline, Heikin Ashi, footprint and TPO; that list does not establish native Range support.
The legacy Backtesting Assistant and Strategy Alerts are separate workflows from native Quant strategy creation. Generating code, plotting a signal or receiving an alert does not prove an order was executed.
Dedicated range-chart platforms
| Platform / workflow | Documented use | What to verify |
|---|---|---|
| TradingView | Select Range in the chart-type menu or choose a range interval. One range unit equals one tick. | Plan access, symbol increment, projection/phantom settings, script compatibility and synthetic backtest limitations. |
| NanoTrader | WH SelfInvest illustrates range charts, including a 30-point example alongside a time-chart inset. | Feed detail, product availability, exact bar rules and realistic fills. The example is not an optimal setting for every index. |
| Native LuxAlgo | Chart context and supported strategy research with Quant. | Current native chart-type support; distinguish a time-bar approximation from a verified range-bar implementation. |
Check the vendor’s current plan and data requirements before subscribing. Older plan names, unrelated subscription-price ranges and claims that one platform is best for a particular index are not a sound basis for choosing range-chart software. Inspect the chart behavior with the instrument and data you intend to use.
Video: how to create range charts
This TradingView tutorial demonstrates range-chart setup and visual settings. It complements the construction and testing distinctions above; a chart tutorial does not validate a trading strategy’s profitability.
Frequently asked questions
Are range bars more accurate than time charts?
They aggregate the same market differently and can make price structure easier to inspect. Visual clarity does not prove more accurate signals, fewer false breakouts or better performance.
Does a 10-range setting mean ten points?
Not necessarily. TradingView defines one range unit as one tick. With a 0.25 tick, ten range units equal 2.50 price units. Verify the platform and symbol units.
What are phantom bars?
In TradingView, phantom bars are virtual bars that fill untraded price gaps. They are not evidence that orders could have filled at those intermediate prices.
Should the range be 10–20% of ATR?
That can be a trial setting, not a universal optimum. Define the ATR timeframe, use information available before the decision, round to valid increments and compare settings on unseen data.
Can I backtest directly on a range chart?
Check the platform’s execution model. TradingView warns that non-standard chart backtests can use synthetic prices and produce unrealistic results. Validate construction and tradable fills rather than accepting the displayed result at face value.
Does native LuxAlgo provide range bars?
The current native chart documentation does not list Range as a chart type. Use supported native charts and Quant for a clearly identified baseline, and verify any separate range-bar implementation before claiming equivalence.
References
- TradingView — Understanding range charts; tick units, chart selection, projection bars and phantom bars; menu illustration.
- WH SelfInvest — NanoTrader chart types; range/time comparison and 30-point illustration.
- TradingView Pine Script — Strategies; non-standard chart and synthetic-price backtesting limitations.
- LuxAlgo — Native charts overview; currently documented chart types and chart setup.
- LuxAlgo — Chart data; symbol and venue context.
- LuxAlgo — Making strategies with Quant and native strategy settings; manual code review, execution and research assumptions.
- TradingView — How Traders Create Range Charts: Tutorial; recorded chart-setup demonstration.
Read next