Concept
TPO Profile
TPO Profile is a Volume & Order Flow concept. The Library holds 1 implementation, a working definition you can pull into Quant.
Top TPO Profile indicator
The top custom implementation, built on the original standard TPO Profile formula.
1 total
From studying TPO Profile to trading it: take the implementation below into Quant and backtest it instantly.
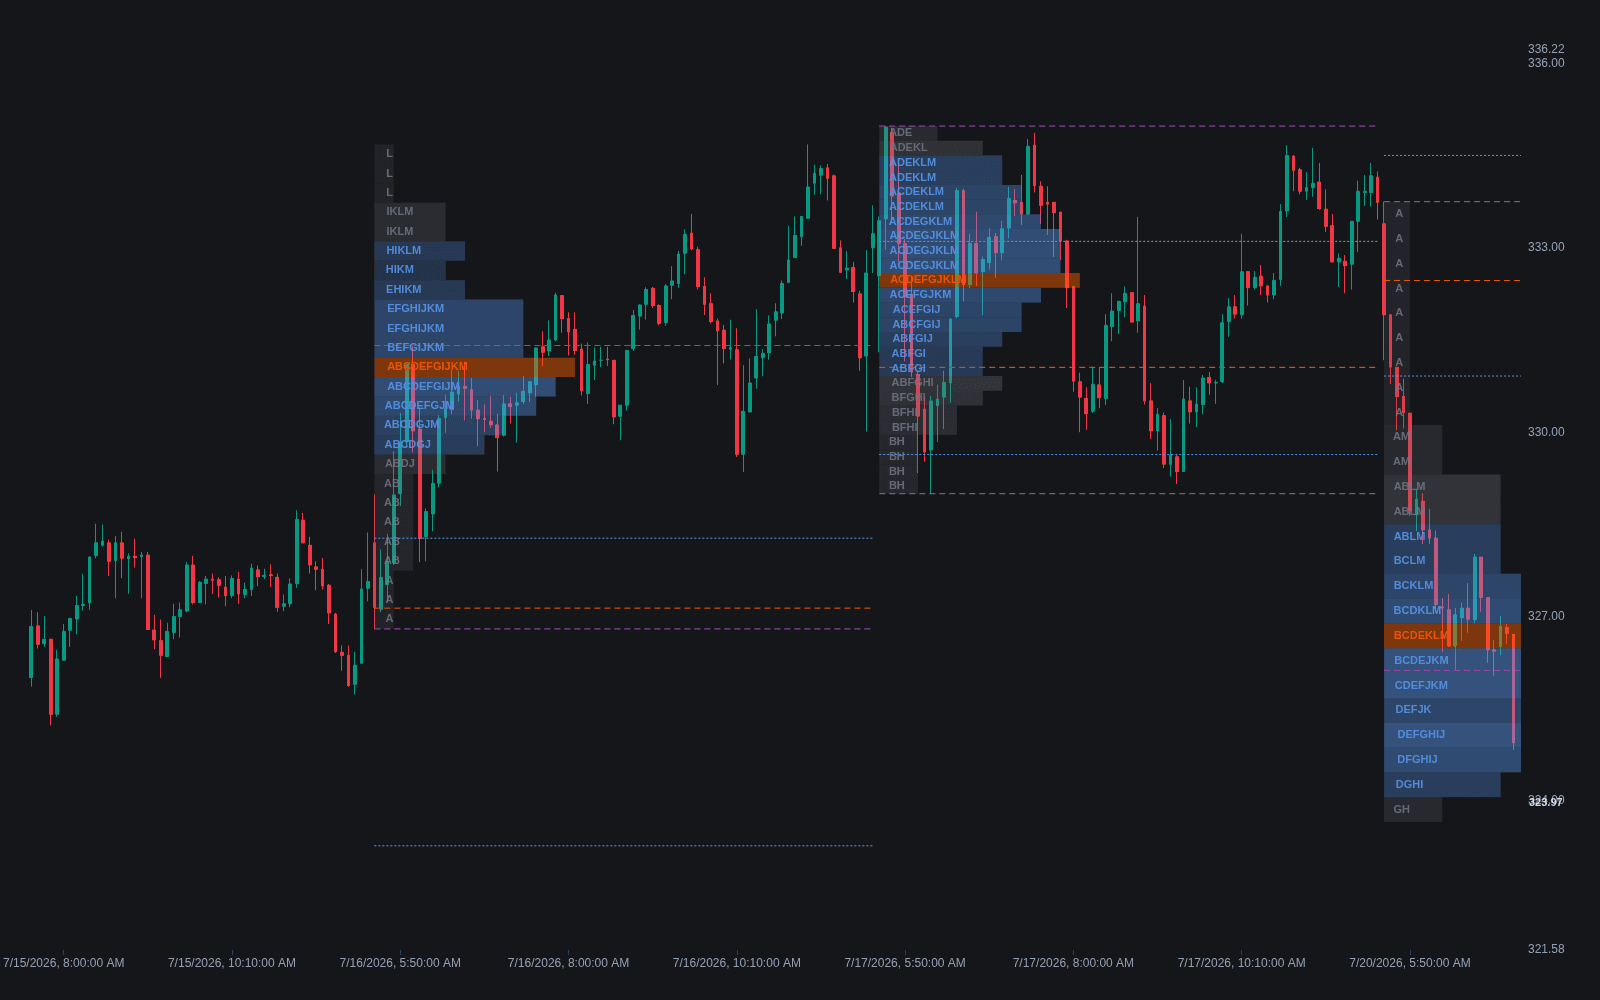
What is a TPO Profile?
A TPO profile, short for Time Price Opportunity and better known as Market Profile, organizes a session by time spent at each price. The session is divided into fixed periods, traditionally 30 minutes, and each period is assigned a letter; every price touched during that period prints its letter once. Stacked up, the letters form a distribution: the row with the most letters is the TPO point of control, and the band holding roughly 70% of all TPOs is the value area. The format was developed by J. Peter Steidlmayer at the Chicago Board of Trade in the 1980s.
Steidlmayer's format shipped through the CBOT in the mid-1980s as a data product for members, and the auction-theory reading that grew around it, markets as ongoing two-way auctions seeking value, was systematized by later educators, most influentially the Dalton tradition of Mind Over Markets. The letters are incidental; the durable idea is treating a session as a distribution under construction rather than a line.
The profile's shape is the primary read. A symmetric bell says the session balanced around accepted value; elongated or lopsided shapes, such as the P and b profiles commonly read as short covering and long liquidation, say one side kept the auction moving. Structural details refine it: single prints mark prices rejected within a single period, and poor (unexcessed) highs or lows mark auctions that finished without conviction. TPOs count time, not size, so a price can accumulate many letters on thin volume, which is why many traders run a volume profile alongside.
Across sessions the vocabulary scales up. One-timeframing, each period extending in the same direction without taking out the prior period's opposite extreme, is the profile's word for persistent directional control; overlapping value areas build the bracket that composite profiles then map; and the day-type taxonomy (trend day, normal variation, neutral day) classifies sessions by how far range extension carried beyond the initial balance. The letters encode all of it compactly enough that experienced readers reconstruct the session's story from the profile alone.
How to read a TPO Profile
A TPO profile is read shape-first, then feature by feature.
- 1Check the period setting: each letter represents one time period, traditionally 30 minutes, and every price touched in that period receives that letter once.
- 2Assess the overall shape: a symmetric bell suggests balance, while elongation or a P or b shape suggests one-sided activity.
- 3Locate the TPO point of control and value area, then scan for structure: single prints, poor highs or lows, and how far range extension carried beyond the initial balance.
- 4Compare against prior sessions: overlapping value suggests a developing bracket, while steadily migrating value suggests trending conditions.
How it's calculated
A sideways histogram of how much time price spent at each level during a session, from which the point of control and value area are derived.
The 70% value area echoes one standard deviation of a normal distribution; it is convention, not a fitted statistic.
Platforms differ on whether one row or a pair of rows is added per step, so VAH and VAL can differ slightly between tools.
A volume profile is the same construction with traded volume per row instead of time counts.
How traders use it
- To classify the day type early: the initial balance, customarily the first two periods, and the extent of range extension beyond it help distinguish balanced rotation from a trend day, setting expectations for the rest of the session.
- As a level map for the next session: prior-day TPO POC, value area edges, single prints, and poor highs or lows are carried forward as references where responsive or initiative behavior is expected to show itself.
- To read balance versus imbalance across days: overlapping value areas signal a market building a bracket, while consistently migrating value signals a one-timeframing trend.
- Merging multiple sessions into a composite TPO profile to frame the larger bracket the market is auctioning within, and the levels where that bracket would break.
- In a modern stack: TPO structure for the auction's time story, a volume profile for size at price, session VWAP for the running average, and volume delta for aggression, with disagreements between the time and volume views flagging prices where the tape's activity was unusual.
TPO Profile vs related concepts
Volume Profile: A volume profile weights each price by traded volume; a TPO profile weights it by time. Their POCs and value areas often sit close together but can separate sharply when heavy volume transacts quickly at one price.
Value Area: Not a rival tool but a component: the central band, customarily 70%, of either a TPO or volume distribution. Which profile it is derived from changes the resulting levels.
Initial Balance: The initial balance is a time bracket covering the session's opening periods, read within the TPO profile. It frames the early range; the full profile shows how the rest of the auction treated that range.
Concept family
Volume & Order Flow
88 concepts mapped · 88 in the Library
TPO Profile FAQ
Turn TPO Profile into a trading strategy.
Take the implementation from this page into Quant, then build on it, backtest it on real data, and keep refining it in conversation.