Time-Weighted Average Price (TWAP): Price Benchmark
The Time-Weighted Average Price (TWAP) is the simple average of a security's price over a chosen window, with every interval counted equally and volume ignored. The same three letters name two related things. As a benchmark, TWAP is the yardstick a trade is judged against: did the order fill better or worse than the average price over the period it was worked? As an execution algorithm, TWAP is the schedule that slices a large parent order into equal child orders sent at regular intervals, so that the average fill lands near that benchmark. Keeping the two apart is most of what this article is about, because the indicator is easy to draw and the algorithm is mostly relevant to orders large enough to move the market.
Key Points
- Formula: TWAP = (P₁ + P₂ + … + Pₙ) ÷ n, where each P is the price at one of n equally spaced intervals in the window.
- Benchmark: a buy that fills below the window's TWAP beat the benchmark; a buy that fills above it paid up. The difference is usually quoted in basis points.
- Algorithm: equal slices at equal intervals across the window. Simple and predictable, blind to liquidity, and the easiest schedule for other participants to detect.
- Who needs it: orders large enough to move the market. For a retail-sized order, a single well-placed order usually costs less than a schedule.
TWAP vs. VWAP
- TWAP: weights every interval equally, so a quiet interval counts as much as a busy one. Robust where no reliable volume pattern exists.
- VWAP: weights each price by the volume traded there, so it measures where business was actually done. The standard intraday benchmark where volume curves are stable. The native VWAP on Quant Charts plots the session version with bands and cross alerts; the Library's session VWAP page covers the reading.
Practical Applications
- Institutional desks: working large orders with limited footprint, and reporting execution quality against the TWAP or VWAP benchmark.
- Systematic traders: using a TWAP line as a neutral reference for where a session or window has traded on average, and building rules around price relative to it.
- Long-term investors: dollar-cost averaging is TWAP logic stretched over months: equal amounts at equal intervals, accepting the average rather than trying to time the entry.
Pros and Cons
- Advantages: predictable timing, a transparent benchmark, and no dependence on a volume forecast.
- Drawbacks: schedule risk in a trending market, indifference to liquidity, and a rhythmic footprint that experienced tape readers look for.
On Quant Charts the native TWAP/VWAP/POV Execution simulator runs the three staple execution schedules side by side on a simulated parent order and scores each against its benchmark, and Quant, our coding agent, can draw a TWAP line for any window and turn a rule around it into a strategy you can inspect in Code and test with Run.
How TWAP Works: Calculation and Display
TWAP Formula Explained
Divide the window into equal intervals, take one price per interval, add them and divide by the count. Because every interval carries the same weight, the busiest hour of the day and the quietest count identically. The hypothetical table shows a one-hour window in 15-minute intervals and, alongside it, the VWAP of the same hour to make the difference concrete.
| Interval (hypothetical) | Price | Volume (shares) | Price × volume |
|---|---|---|---|
| 10:00 to 10:15 | $150.25 | 120,000 | $18,030,000 |
| 10:15 to 10:30 | $150.50 | 60,000 | $9,030,000 |
| 10:30 to 10:45 | $150.75 | 40,000 | $6,030,000 |
| 10:45 to 11:00 | $151.00 | 30,000 | $4,530,000 |
| TWAP | ($150.25 + $150.50 + $150.75 + $151.00) ÷ 4 = $150.625 | ||
| VWAP | $37,620,000 ÷ 250,000 = $150.48 | ||
Most of the hour's volume traded early and low, so the VWAP sits below the TWAP by about 14 cents. A buyer who filled at $150.55 beat the TWAP benchmark by 7.5 cents, about 5 basis points, and missed the VWAP benchmark by 7 cents. Same fills, two verdicts, which is why the benchmark has to be named before execution quality is discussed.
Time Interval Effects on TWAP
The interval decides how many observations enter the average. Fine intervals follow price closely and let a single spike or gap pull the average; coarse intervals smooth the line and can skip the extremes entirely. For an execution schedule the interval also sets the child-order count: a two-hour order in ten-minute slices is twelve child orders, in five-minute slices twenty-four. More slices reduce the footprint of each and increase the number of fills exposed to spread and fees, so the choice is a cost trade-off rather than a matter of precision. There is no interval that is right for a market or a trader type; there is the interval you tested, on the instrument you trade, with its actual costs.
TWAP Display on Trading Platforms
As an indicator, TWAP is drawn as one line anchored to the start of the window and updated as each interval closes, so it flattens as the window matures and more observations dilute each new one. Price above the line means the market is currently trading above the window's average; below means the reverse. Read that as position relative to a benchmark rather than as a signal: a market that trended up all session sits above its TWAP simply because the average includes the lower morning prices. Where an execution desk is being measured against a benchmark, price often reacts around it, which is one reason session VWAP is watched so closely; TWAP lines attract less attention because fewer participants are measured against them.
What Is a TWAP Trading Strategy? Video Overview
QuantInsti published this explainer in September 2023. It covers TWAP as an execution schedule and where it fits among algorithmic trading strategies; treat any examples as illustrations of the mechanics rather than as evidence about results.
TWAP Trading Applications
Reducing Market Impact with TWAP
Large orders move prices against themselves. Submitting institutional size at once consumes the visible book, signals intent and degrades the fill with every level swept. Slicing spreads the demand across time, reducing impact at the cost of exposure to price drift during the schedule. The hypothetical table works a 12,000-share buy order over two hours in ten-minute slices and scores the result against the window's TWAP.
| Item | Calculation | Result |
|---|---|---|
| Parent order | 12,000 shares over 120 minutes | 12 child orders of 1,000 shares, one every 10 minutes |
| Window TWAP | Average of the 12 interval prices | $48.40 |
| Average fill | Total cost ÷ 12,000 | $48.46, because each slice paid part of the spread |
| Slippage against TWAP | ($48.46 − $48.40) ÷ $48.40 | About 12 basis points, or $720 on the order |
| Alternative: one market order at 10:00 | Sweeps three price levels | Average fill $48.55 in this scenario; about 31 basis points above the eventual TWAP |
| Trending case | Price rises steadily through the window | Later slices pay more; the schedule matches the TWAP but the TWAP itself is far above the opening price |
The last row is schedule risk, and it is the price of any patient schedule: matching the benchmark is not the same as getting a good absolute price. The choice between immediacy and patience depends on how fast the reason for the trade decays, which is exactly the trade-off the native simulator below makes visible.
TWAP for Low-Liquidity Markets
TWAP is the schedule of choice where no reliable volume profile exists: around-the-clock markets, thin sessions, newly listed instruments and many crypto pairs on weekends. A VWAP schedule needs a forecast of when volume will arrive; if the forecast is wrong the schedule is wrong. An even time schedule makes no forecast. The cost is that it trades the same amount into thin periods as into busy ones, so in a market with a strong intraday volume pattern it can be the more expensive choice.
TWAP for Institutional and Retail Traders
For institutions the benchmark doubles as a reporting tool: a fill is compared with the TWAP or VWAP of its window, and the difference in basis points is the execution report. For most retail traders the honest answer is that slicing earns nothing: if the order is small relative to the book, one well-placed order costs less than a schedule of twelve, each paying its own spread. Where the TWAP idea does help a smaller trader is as a reference line for rules and as the logic behind dollar-cost averaging, and, on the other side of the tape, as a pattern to recognize. Scheduled execution leaves footprints, uniform clip sizes at metronomic intervals with persistent one-sided pressure, and production algorithms randomize size and timing precisely because those footprints are detectable.
TWAP Benefits and Drawbacks
TWAP Pros and Cons Comparison
The benefits are simplicity and predictability. The schedule is known in advance, completes on time by construction, requires no volume forecast, and produces a benchmark anyone can recompute from public prices. The drawbacks follow from the same simplicity. It ignores liquidity, so it trades into thin periods; it is rigid, so it keeps buying while price runs away; and its regularity is the easiest of the three staple schedules to detect. Whether the trade-off favors TWAP over VWAP or a participation schedule depends on the market's volume pattern and the urgency of the order, not on the instrument's asset class.
| Advantages | Disadvantages |
|---|---|
| Reduces market impact relative to a single large order | Schedule risk: matches the benchmark while price trends away |
| Predictable timing and guaranteed completion within the window | Trades equally into thin and busy periods |
| No dependence on a volume forecast | Regular slices are the easiest schedule for others to detect |
| Transparent benchmark computed from public prices | More child orders means more spread and fee exposure |
| Useful where volume patterns are unreliable | Earns nothing for orders small relative to the book |
U.S. Market Considerations for TWAP
Two structural facts shape how TWAP is used in U.S. equities. Brokers owe their clients a duty of best execution, and a benchmark such as TWAP or VWAP gives that duty a measurable form: the fill is compared with the average price the market offered over the same window. And the market is fragmented across exchanges and off-exchange venues, so a scheduled order is routed venue by venue as it works, which is a routing problem for the broker rather than a property of the benchmark. The regular session runs from 9:30 a.m. to 4:00 p.m. Eastern; volume and spreads are typically highest near the open and the close, and whether a TWAP window should include those minutes is a decision to test, not a rule.
TWAP on Quant Charts
The Native Execution Simulator
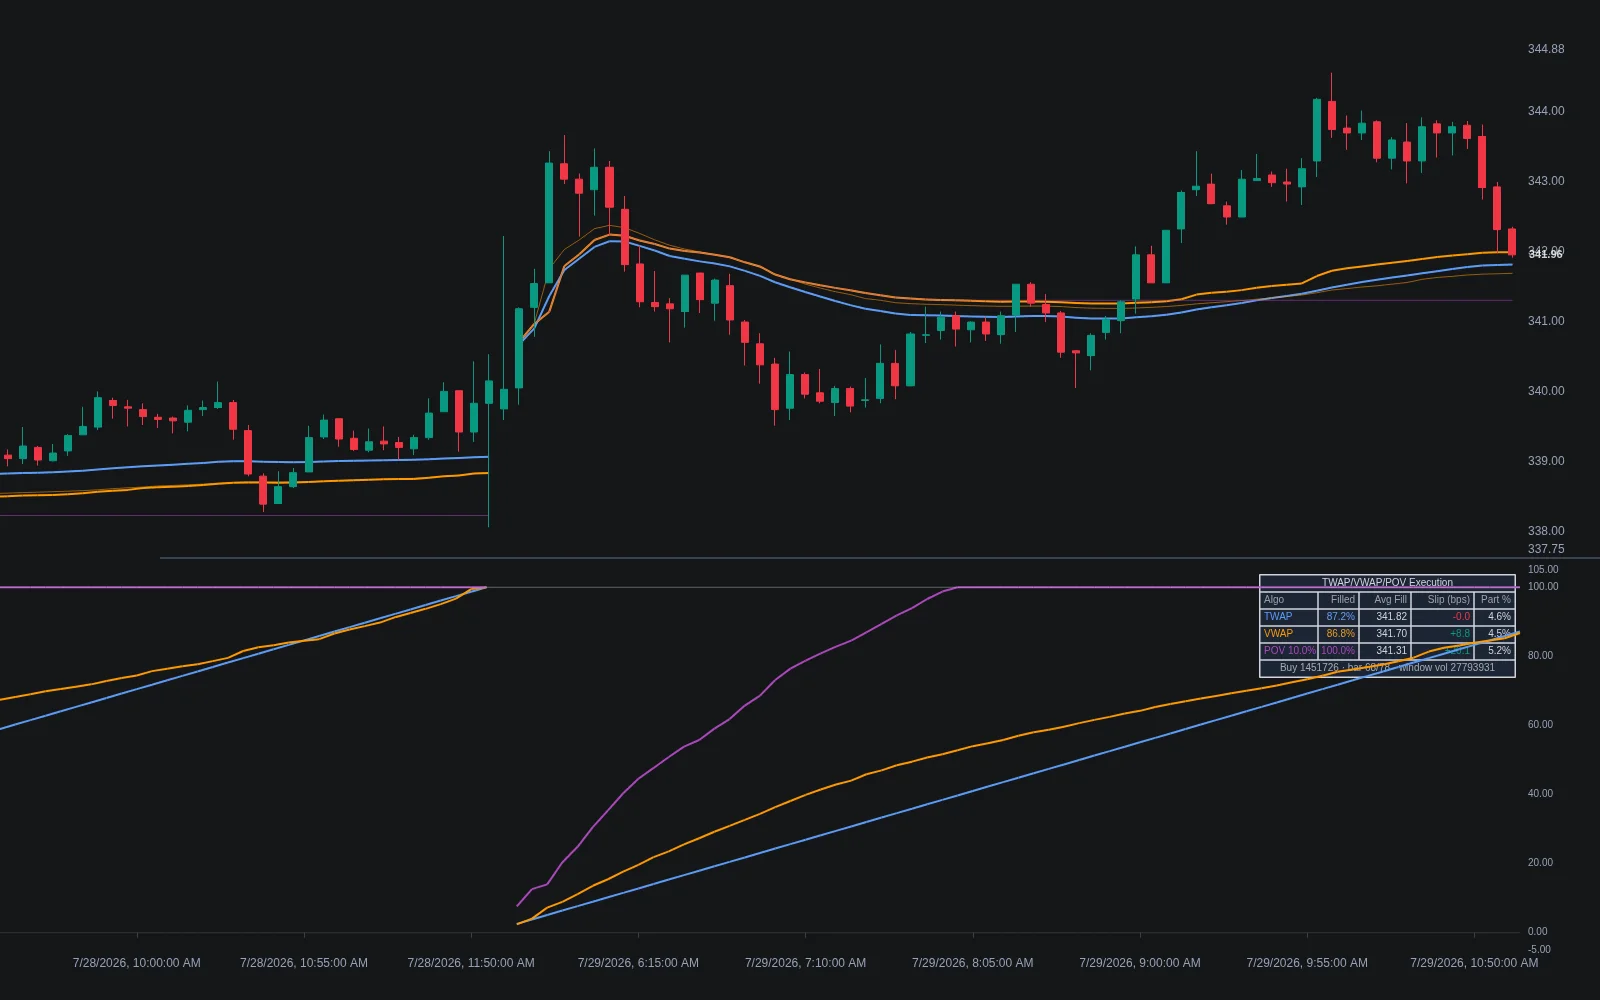
The Library's TWAP/VWAP/POV Execution works one simulated parent order three ways at once inside each execution window. TWAP slices it evenly, VWAP distributes it along the expected volume profile built from previous windows, and POV chases a fixed share of the volume that actually prints. Each schedule's average fill is scored against its own benchmark, TWAP against the window's average price and VWAP and POV against the volume-weighted price, with slippage reported in basis points and signed so that a buy wins by filling below the benchmark. Its fills are idealized by design, every child order filling at the bar's chosen price with no spread, queue or impact, so what it isolates is scheduling, not microstructure. It opens on Quant Charts from its Library page.
| Input | Default | What it controls |
|---|---|---|
| Order Side | Buy | Signs the slippage; a buy wins by filling below the benchmark |
| Sizing Mode | % of Average Window Volume, 5% | Parent size as a share of typical window volume, or a fixed number of units (10,000) |
| Execution Window | D | The anchor period that defines one episode; must exceed the chart timeframe |
| Schedule Length (bars) | 0 | Child slices for TWAP and VWAP; 0 spans the full window |
| POV Participation Rate | 10% | Share of printed volume the POV schedule targets |
| Volume Profile Lookback | 10 windows | Completed windows averaged into the expected volume curve |
| Fill / Benchmark Price | hlc3 | The price standing in for child fills and benchmarks |
Two other native tools complete the set. The VWAP plots the session, weekly or monthly volume-weighted average with optional standard-deviation bands and cross alerts, and the Anchored VWAP starts the same calculation at a bar you choose; the Library's anchored VWAP page covers the reading. A TWAP line is the equal-weighted cousin of both: the simple average of prices since the anchor, which Quant can draw in a few lines of code.
Testing a TWAP Rule with Quant
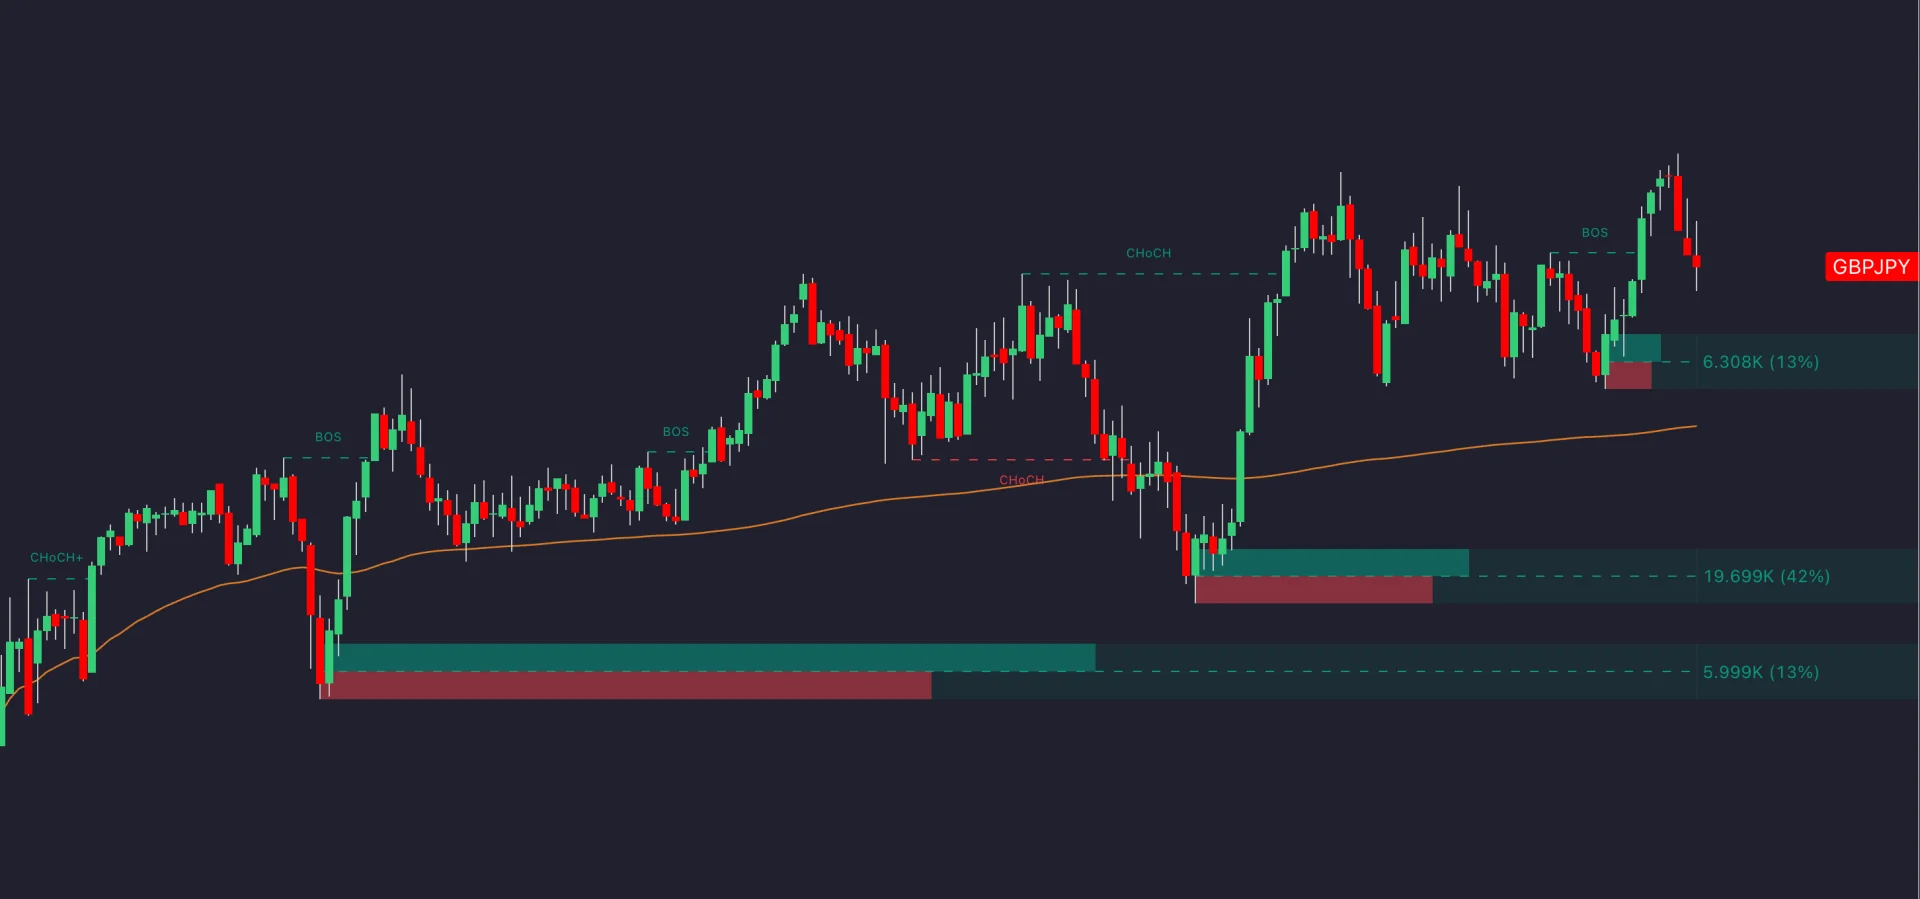
Describe the line first: the average of closes from the session open, or from a chosen anchor, to the current bar, drawn on the chart with an alert when price crosses it. Then describe the rule around it, for example buying a close back above the session TWAP after a dip below it while a higher-timeframe filter is up, with the stop below the dip's low, the target at the next zone and the position sized from the stop distance. Inspect the Code to confirm the anchor and the closed-bar evaluation, then click Run. The Making Strategies with Quant guide shows the workflow, and the native backtest guide explains the Backtest Summary: net profit, trade count, win rate, maximum drawdown and profit factor, with commission and slippage set in the strategy properties.
Compare the TWAP-line rule against the same rule on the session VWAP and on a fixed-length moving average, on identical data and costs, and read trade count before return. For execution questions, run the native simulator across several windows and markets and compare the three schedules' slippage distributions rather than a single day's number. The Library's market-structure tools supply structure from their own logic and do not read any average; agreement between them and a cross of the line is confluence to test rather than confirmation. The LuxAlgo platform does not place orders for you; it is a charting platform.
TWAP Summary and Key Points
TWAP is the equal-weighted average of price over a window, used as a benchmark for execution quality and as the schedule for working a large order in equal slices. It is simple, predictable and independent of any volume forecast, which makes it the right schedule where volume patterns are unreliable, and blind to liquidity and to trends, which makes it the wrong one when the market has a strong intraday volume curve or the reason for the trade decays quickly. For an order too small to move the market it earns nothing.
The native TWAP/VWAP/POV Execution simulator on Quant Charts makes the trade-offs among the three staple schedules visible on any market, the native VWAP and Anchored VWAP cover the volume-weighted benchmarks, and Quant can draw a TWAP line and test a rule around it. Whatever the test shows, name the benchmark before judging the fill.
FAQs
Is TWAP an indicator or an execution algorithm?
Both, and the distinction matters. As an indicator it is the equal-weighted average price over a window, drawn as one line and used as a benchmark. As an algorithm it is the schedule that slices a large order into equal child orders at regular intervals so the average fill lands near that benchmark. The indicator is useful to anyone; the algorithm mainly to orders large enough to move the market.
What is the difference between TWAP and VWAP?
TWAP weights every interval equally and ignores volume; VWAP weights each price by the volume traded there, so it measures where business was done. VWAP is the standard intraday benchmark where volume curves are stable, and TWAP is the more robust choice where no reliable volume pattern exists, such as thin sessions or around-the-clock markets.
How do time intervals affect a TWAP schedule?
The interval sets the number of child orders. Finer intervals mean more, smaller slices with less footprint each but more spread and fee exposure; coarser intervals mean fewer, larger slices. Neither is right in general; the interval is a cost trade-off to test on the instrument and window you actually trade.
Should a retail trader use a TWAP schedule?
Usually not for execution. If the order is small relative to the book, one well-placed order costs less than a schedule of many, each paying its own spread. The TWAP idea still helps smaller traders as a reference line for rules and as the logic behind dollar-cost averaging.
Can I simulate TWAP execution on Quant Charts?
Yes. The native TWAP/VWAP/POV Execution indicator works a simulated parent order three ways inside each execution window, plots completion curves and benchmark and fill lines, and scores each schedule's slippage in basis points. Its fills are idealized, so it isolates scheduling rather than microstructure. It opens on Quant Charts from its Library page.
How is slippage against TWAP measured?
Take the average fill price of the order, subtract the TWAP of the same window, and express the difference as a fraction of the TWAP in basis points. For a buy, filling below the benchmark is favorable; for a sell, filling above it is. The sign convention and the window must be stated for the number to mean anything.
References
LuxAlgo Resources
- Quant Charts
- LuxAlgo Quant
- TWAP/VWAP/POV Execution Indicator
- TWAP/VWAP/POV Execution Concept
- VWAP Indicator
- Anchored VWAP Indicator
- Session VWAP
- Anchored VWAP Concept
- Execution Algo Footprints
- Simple Moving Average
- Dollar-Cost Averaging
- Making Strategies with Quant
- Native Backtest Guide
External Resources
Read next