Volume Delta Indicator: Comparing Up-Volume vs Down-Volume
Volume delta compares two directionally classified volume totals within a period. The calculation is simple; the important question is how the tool decides which side each trade or candle belongs to. Up-volume from price changes is not automatically the same as buyer-initiated volume from an aggressor-classified feed.
Use LuxAlgo’s native Volume Delta to examine supported order-flow data alongside price, then work with Quant to test an explicit strategy rule. Delta can provide useful context, but it does not identify institutions, reveal hidden intentions, or guarantee a trend’s next move.
Up-Volume and Down-Volume Depend on the Method
| Classification | What it uses | Meaning of the two sides | Main distinction |
|---|---|---|---|
| Tick direction | A trade’s price relative to an earlier trade price | Uptick versus downtick volume under the implementation’s rule | A price change is not direct identification of the aggressor |
| Bid/ask or aggressor classification | Execution data and the feed’s classification method | Buyer- versus seller-initiated volume | Requires appropriate data and treatment of ambiguous executions |
| Candle-direction estimate | Price direction within lower-timeframe bars | Volume assigned to positive or negative intrabars | Estimates direction from candles rather than classifying every execution |
Every executed trade has a buyer and seller. “Buying volume” in an aggressor-based calculation generally means the buyer initiated the trade against available sell liquidity; it does not mean that the trade lacked a seller.
TradingView’s built-in Volume Delta uses lower-timeframe price changes to estimate positive and negative volume. It is therefore important to distinguish that implementation from a feed that classifies executions by aggressor side. Do not assume tools with similar names use identical inputs.
1. Up-Volume
Under a simple tick-direction example, a hypothetical 1,000-share trade at $150.25 after a trade at $150.20 contributes 1,000 shares to up-volume. The example describes a price-based classification; it does not establish that an institution bought those shares.
Unchanged-price trades need an explicit rule, such as carrying forward a previous direction or leaving a separate neutral category. Check the implementation instead of silently treating every unchanged trade as a new uptick or downtick.
When up-volume increases near resistance, record the observation and the subsequent price reaction. Price might break through, stall, or reject the level. A large opening burst can reflect normal session activity or an event; it is not proof of institutional accumulation.
2. Down-Volume
Under the same tick-direction approach, a hypothetical 2,500-share trade at $245.80 after a higher-priced trade contributes to down-volume. That tells you how the price moved between observations, not whether the seller was closing a long, opening a short, or managing another exposure.
Increasing down-volume at support can accompany a breakdown or a rejection of lower prices. Falling price with less down-volume may indicate a change in activity, but does not guarantee that selling has ended. Evaluate the signal against a defined price rule.
Calculate and Interpret Volume Delta
For a total-volume calculation using two comparable classified sides:
Delta = positive-side volume − negative-side volume.
Suppose a bar has 6,000 units on the positive side and 4,000 on the negative side. Delta is +2,000 and total classified volume is 10,000. If you choose to normalize it, delta divided by total classified volume is 20%. That percentage is a custom comparison unless the selected tool explicitly provides it.
A second bar with 600 positive and 400 negative units has delta +200 but the same 20% normalized imbalance. The absolute activity is very different. Specify which measure your strategy uses and handle a zero denominator explicitly.
Positive delta does not force price to rise, and negative delta does not force it to fall. The relationship between executed activity and price depends on available liquidity and how trading unfolds. A mismatch is something to investigate, not a participant-identity detector.
Delta Versus Cumulative Volume Delta
Per-bar delta describes one bar. Cumulative Volume Delta (CVD) adds deltas from a selected anchor. A positive cumulative value can be falling if the newest delta is negative; its level and slope answer different questions.
Do not compare cumulative swings across resets without accounting for the changed starting point. A reset is a calculation boundary, not a sudden reversal of market sentiment.
Read Volume Delta on LuxAlgo’s Native Charts
Add Volume Delta from Indicators → Orderflow. Native Volume Delta and CVD use footprint buy/sell volume, require a footprint-capable symbol and fixed-duration bars, and are unavailable on monthly chart timeframes. Check data coverage before interpreting a blank pane.
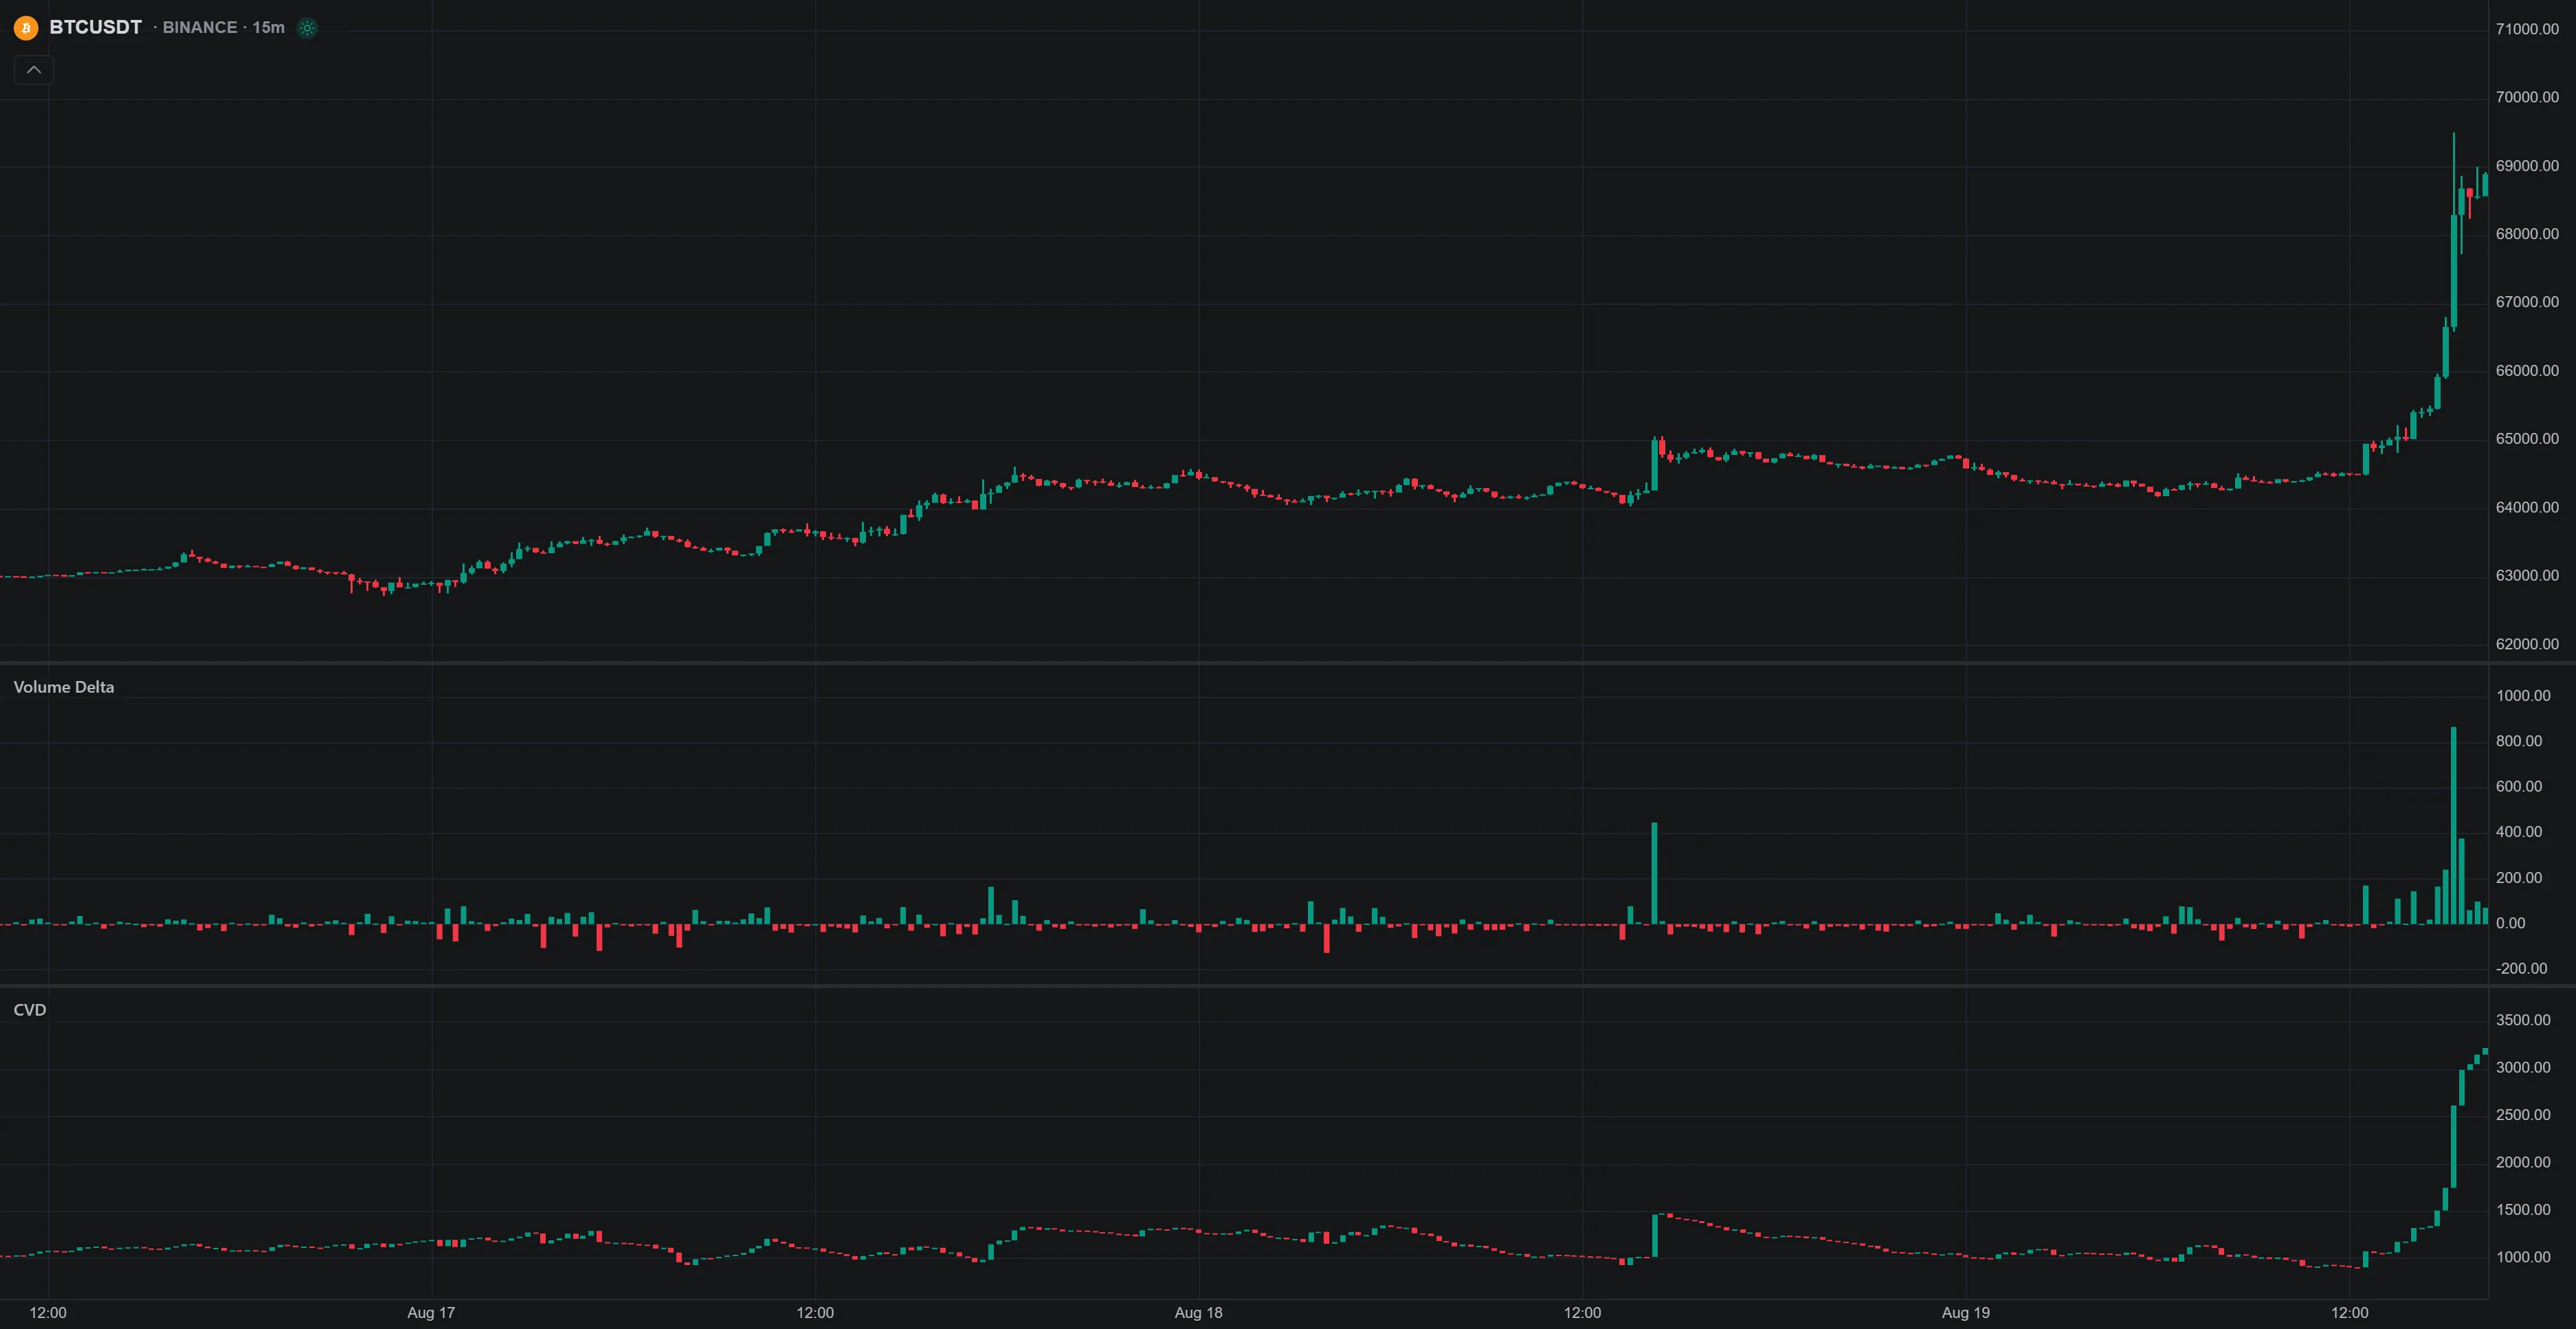
Total mode uses total buy volume minus total sell volume. Average mode compares average trade size per side and requires per-side trade counts; missing counts produce gaps. Average mode is not total net volume and does not identify whether larger trades came from institutions.
CVD provides Candles, Line, and Area styles, with UTC Day, Week, Month, or All data anchors. Month is the default anchor; this is distinct from a monthly chart interval. Review the native settings before comparing charts.
Combine Delta with a Defined Price Setup
| Setup | Candidate delta condition | What still needs defining |
|---|---|---|
| Break above resistance | Positive delta on the completed breakout bar | The resistance rule, entry timing, invalidation, and costs |
| Break below support | Negative delta on the completed breakdown bar | What counts as a failure or reclaim of the level |
| Trend filter | Several bars meeting a stated delta comparison | Lookback, normalization, data source, and price trend definition |
| Potential reversal | A mismatch between price and a specified delta or CVD measure | Corresponding swings, confirmation delay, and entry trigger |
A moving average can supply a price-trend condition, while RSI or MACD can contribute a momentum rule. Neither a reading above RSI 50 nor a negative MACD crossover makes a delta signal certain to succeed. Related price indicators are not independent votes.
Compare the same strategy with and without the extra condition. A requirement for volume to exceed average by 50% is a threshold to evaluate, not a universal breakout standard. Intraday, use a time-appropriate baseline such as the approach explained in Relative Volume at Time.
Keep Signal Timing Honest
If divergence relies on a confirmed swing, it becomes available only after the required later bars. Using that confirmation to enter at the earlier pivot introduces information that was unavailable at the decision time. Unfinished delta bars can also change before closing.
For price-level context, native Volume Profile can show where activity occurred. Fix the selected window and keep developing levels distinct from final historical levels.
Test Delta Rules with Quant
- Specify the classification. State whether you require aggressor-side data, tick-direction data, or a candle-based estimate.
- Define the calculation. Include total versus average mode, lookback, normalization, anchor, and missing-data treatment.
- Define the trade. State the price trigger, entry timing, stop, exit rule, and sizing.
- Review the implementation. Ask Quant to build the strategy, then confirm access to the required inputs. Do not silently substitute candle estimates for unavailable execution data.
- Validate the comparison. Include commission and slippage in native strategy settings, inspect trades and drawdown, and reserve later data for testing.
A visual indicator or Library example does not guarantee identical strategy access. LuxAlgo’s Volume Delta Candles Library indicator and TradingView toolkits are separate implementations to examine on their own terms.
Risk Comes from the Trade, Not the Delta Reading
For a hypothetical share trade at $60 with a $58 stop, a $200 risk budget, and $0.10 per share in estimated execution costs, position size is floor($200 ÷ $2.10) = 95 shares, or $199.50 of planned risk. A stronger delta reading does not remove that loss exposure.
Use the correct point or contract value for other instruments and consider existing positions. Gaps and slippage can produce larger losses. CME’s position-sizing guide explains why size should follow the defined risk and stop distance.
Video: Volume Delta Indicator and Strategies
This Tickblaze tutorial provides another platform’s volume-delta demonstration. Check its calculation and data source before comparing its examples with LuxAlgo or TradingView.
Advantages and Limitations
Delta separates directional classifications that ordinary total volume does not show. It can help investigate a price move or test an additional condition. Its usefulness depends on consistent data, an appropriate comparison, and the strategy being evaluated.
- Coverage: a feed may not include every venue or type of execution. Inspect its scope instead of assuming all activity is visible.
- Classification: tick direction, bid/ask information, and candle estimates can disagree.
- Interpretation: delta does not disclose ownership, motives, open positions, or a hidden order’s remaining size.
- Events: earnings, auctions, rebalancing, and other events can change activity without establishing a repeatable signal.
- Alerts: a threshold notification identifies a condition already observed under the tool’s rules. It does not predict the next move or place an order by itself.
Do not assume that combining up-volume and down-volume repairs missing data or reveals manipulation. Record failures as well as successes, and evaluate whether the method improves the intended setup after costs.
FAQs
What makes the Volume Delta Indicator different from traditional volume metrics in trading?
Total volume reports activity without subtracting one directional category from another. Delta subtracts the negative-side volume from the positive-side volume under a specified classification. Check whether that classification uses execution data, tick direction, or candle-based estimates before interpreting the result.
What are common mistakes traders make when analyzing up-volume and down-volume data?
Common mistakes include treating different classification methods as identical, assuming delta identifies institutions or intent, ignoring missing data and session effects, and using unfinished or hindsight-confirmed signals. Read the data method first and test a defined price-and-delta rule.
How can I use the Volume Delta Indicator with other technical tools to improve my trading strategy?
Give each tool a clear role, such as a moving-average trend filter and a completed-bar delta condition. Compare the same strategy with and without the extra filter, include costs, and validate on later data. Combining indicators does not guarantee better results.
Read next