Concept
Alternative Bar Types
Alternative Bar Types, also known as range, tick, volume, delta bars, are Meta & Composition concepts. The Library holds 1 implementation, a working definition you can pull into Quant.
Top Alternative Bar Types indicator
The top custom implementation, built on the original standard Alternative Bar Types formula.
1 total
From studying Alternative Bar Types to trading it: take the implementation below into Quant and backtest it instantly.
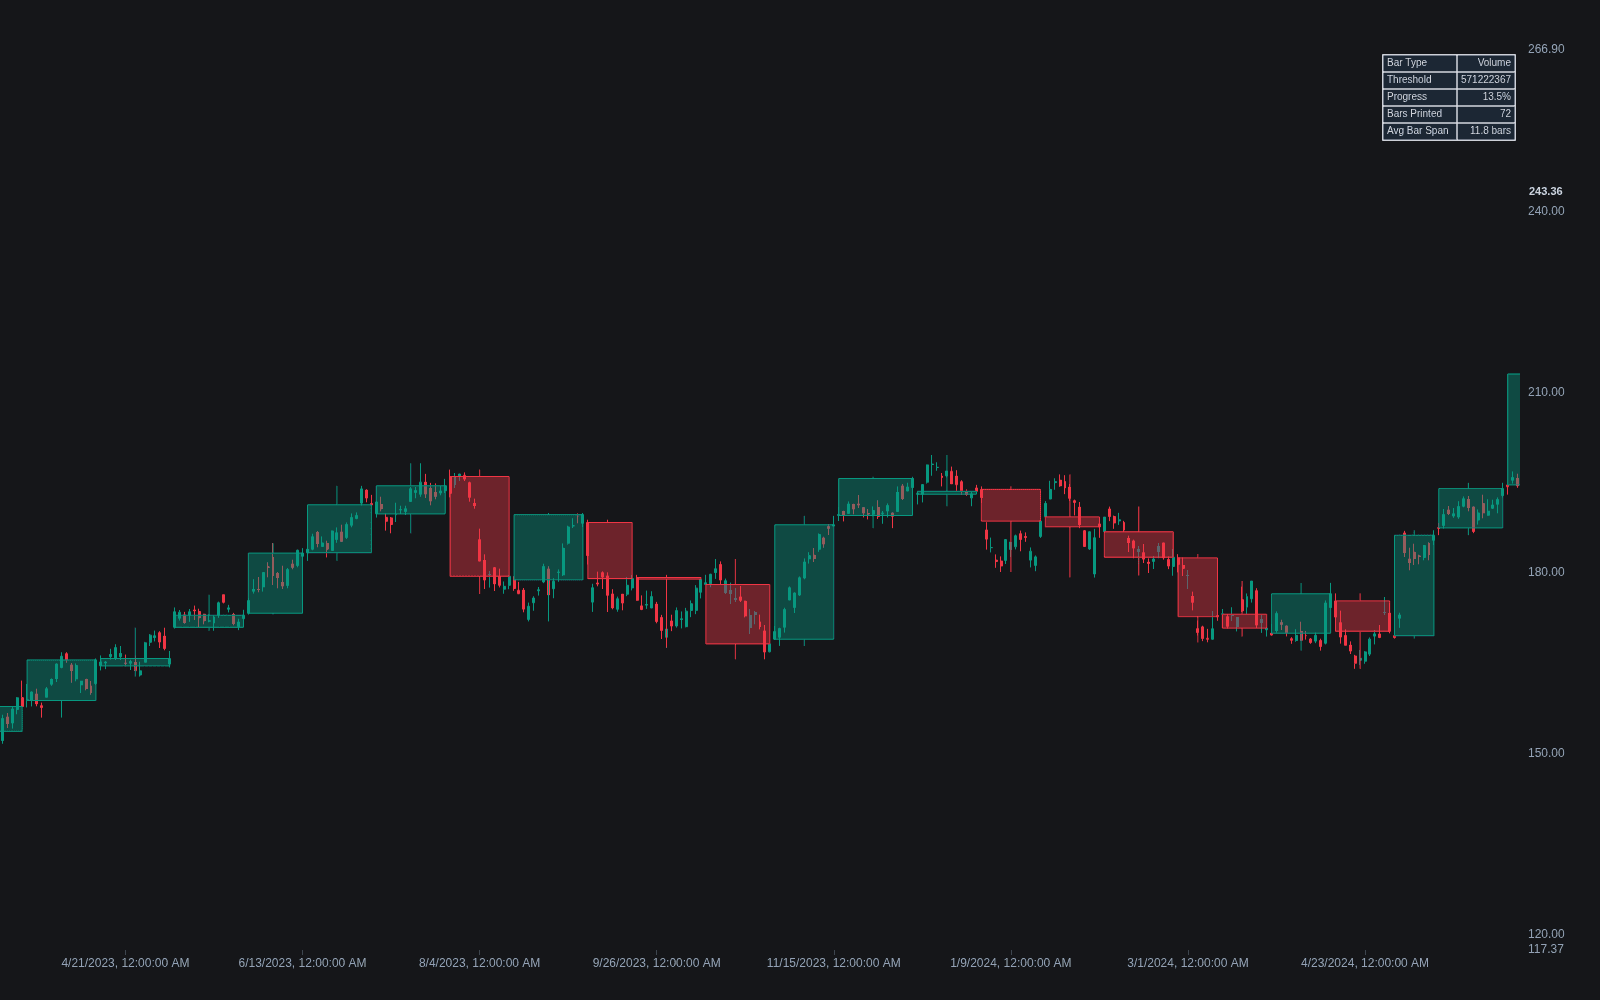
What are Alternative Bar Types?
Alternative bar types replace the clock as the trigger for printing a new bar. A standard chart closes a bar every N minutes no matter what traded; alternative bars close on activity instead. Tick bars close after a fixed number of trades, volume bars after a fixed amount of volume, dollar bars after a fixed traded value, range bars once price covers a fixed high-to-low span, and delta bars once the net difference between buy-side and sell-side volume reaches a set size. The trades are the same; what changes is how they are grouped along the x-axis.
The effect is activity-based sampling. Busy periods print many bars and quiet periods print few, so each bar carries a roughly comparable amount of trading, and dead stretches compress instead of flatlining across the chart. Market-microstructure researchers have argued that returns sampled this way have more stable statistical properties than clock-time returns, which is why activity bars appear in systematic pipelines as well as on discretionary charts. The trade-offs are real: elapsed time is no longer readable from bar spacing, indicator values shift because lookbacks count events rather than minutes, and anything anchored to the clock, such as sessions or opens, needs explicit handling.
The idea predates the charts: Clark's 1973 work on subordinated processes found price changes look closer to normally distributed when measured per unit of volume rather than clock time, and Mandelbrot had proposed trading time as the market's natural clock even earlier. Range bars are commonly credited to Vicente Nicolellis, a Brazilian trader working in the mid-1990s, and López de Prado's financial machine learning work re-popularized tick, volume, and dollar bars for research datasets.
Adopting activity bars changes the engineering around a chart. The threshold becomes the de facto timeframe and goes stale as participation shifts, so many users scale it to average activity, a form of adaptive parameterization. Automation needs review too: bars can close in bursts during news and rarely overnight, affecting alerts and webhooks keyed to bar closes, and inherited clock-chart rules deserve revalidation, basic signal hygiene when sampling changes.
How to recognize and set up activity bars
Alternative bars are usually a chart-type setting rather than an indicator; the tell is the x-axis.
- 1Check timestamps: activity-chart bars are irregular, seconds apart in busy trade and far apart in quiet trade, with counts varying session to session.
- 2Pick the unit matching your question: ticks for trade count, volume or dollar value for participation, range for movement, delta for one-sided pressure.
- 3Size the threshold so a typical session prints a workable number of bars, and revisit it when average activity shifts.
- 4Keep a time reference such as session shading or a clock chart alongside, since elapsed time can no longer be read from bar spacing.
How it's calculated
Bars that close when an activity threshold is reached instead of when a fixed time interval ends.
Bar frequency follows activity, so busy markets print more bars and quiet markets fewer.
Every completed range bar spans exactly R; implementations differ on whether the next bar opens at the prior close or one tick beyond it.
Trade sign comes from the aggressor side, or from a tick rule when aggressor data is unavailable.
How traders use it
- To normalize indicator inputs: an oscillator computed on tick or volume bars sees a comparable amount of trading in every bar, which reduces quiet-session flatlines and news-burst distortion without touching its settings.
- To simplify structure: on range bars every bar spans the same height, so congestion collapses into a handful of bars while directional moves print as clean runs, changing how consecutive-close or bar-count rules behave.
- To foreground participation: volume and delta bars devote chart space to where trading actually happened, making absorption and one-sided pressure easier to see than on a clock chart with a separate volume pane.
- As an execution layer: levels are prices rather than times, so higher-timeframe references and HTF-level proximity filters still work on activity charts while session context stays on a clock chart, a top-down analysis division of labor.
- Inside a full system: swapping bar type changes every stage of a filter-setup-trigger-exit architecture, including trend/range classifiers, so each rule is retested on the new sampling rather than carried over.
Alternative Bar Types vs other chart transforms
Renko: Renko rebuilds price from fixed-size bricks: a new brick needs a set move, and a reversal typically needs two bricks' worth. It discards time and intra-brick detail entirely, while tick, volume, and range bars still print full OHLC bars on a non-clock schedule.
Heikin Ashi: Heikin Ashi keeps the clock but replaces each bar's OHLC values with smoothed averages, so bars stop showing true traded prices. Alternative bar types do the opposite: every printed price is real, but when a bar closes is decoupled from time.
Chart Scales: Log versus linear scaling re-maps the price axis and leaves sampling untouched; activity bars re-map the time axis and leave prices untouched. They address different distortions and combine freely; a log-scaled range-bar chart is coherent.
Concept family
Meta & Composition
28 concepts mapped · 28 in the Library
Alternative Bar Types FAQ
Turn Alternative Bar Types into a trading strategy.
Take the implementation from this page into Quant, then build on it, backtest it on real data, and keep refining it in conversation.