Volume Spikes: Timing Trades with Precision
A volume spike is an unusually large amount of trading activity relative to a defined baseline. It can accompany a breakout, a reversal, or a short-lived news reaction. The spike draws attention to a market event; price structure and execution rules determine whether it becomes a trade.
Use LuxAlgo’s native charts to inspect the activity, then work with Quant to build and test explicit price-and-volume rules. Good timing starts with knowing what information was available at the trigger, not assuming that high volume predicts direction.
Define a Volume Spike Before Trading It
Compare the same instrument, venue, session, and volume units. Shares, contracts, crypto turnover, and forex tick activity are different measurements. Missing data should not be interpreted as low participation.
If a completed bar trades 200,000 shares against an average of 100,000 for the comparison bars, it has twice the volume: 200% of average, or a 100% increase. A 200% increase would mean 300,000 shares. Specify whether the average excludes the signal bar and whether the comparison uses individual bars or cumulative session activity.
Intraday, comparing equivalent times in earlier sessions may be more informative than comparing the current hour with the immediately preceding hour. Opening, midday, and closing activity can differ. Relative Volume at Time explains time-matched regular and cumulative comparisons. An unfinished bar has not reached its final volume.
Three Ways to Analyze a Volume Spike
Breakout Confirmation
Mark support or resistance before price crosses it. Define whether your setup requires an intrabar trade beyond the level, a completed close, or a later retest. Unusually high activity can support the observation that the move attracted participation, but it does not guarantee continuation.
If the signal requires the final candle’s volume, the strategy cannot enter earlier using that future total. Test the volume filter against the same price-only breakout rule. See volume confirmation for breakout trading for the distinction between a qualifying signal and a successful outcome.
Potential Trend Reversal
A spike after an extended move or near a key level may accompany exhaustion, but it can also accompany continuation. Double or triple average activity does not establish a universal reversal probability.
Define the price evidence required next: a return inside a range, a break of a swing level, or another specific condition. VWAP or OBV can provide context, but neither turns the spike into a guaranteed turning point. A trade that requires later confirmation must use the later entry price and its resulting risk.
Scalping During Active Periods
More activity may coincide with better liquidity, but it can also arrive with volatility, wider spreads, thin displayed depth, and adverse fills. Inspect the current bid-ask spread and available liquidity rather than inferring execution quality from volume alone.
Scalping depends heavily on costs and order handling. A modest gross price move can be consumed by the spread, commissions, and slippage. Manual short-term trading is not the same as high-frequency trading, and a chart alert cannot guarantee a timely fill.
Understand the Volume Indicators
| Tool | What it measures | Important distinction |
|---|---|---|
| Relative volume | Current quantity divided by a chosen average | The baseline and completed-bar timing matter |
| Percentage Volume Oscillator | Relative difference between fast and slow volume averages | It measures volume momentum, not price direction |
| On-Balance Volume | Cumulative volume signed by changes in closing price | It does not count actual aggressive buys and sells separately |
| VWAP | A volume-weighted price reference over an anchored window | It is not intrinsic value or every trader’s cost basis |
What a Volume Oscillator Reading Means
The Percentage Volume Oscillator uses: 100 × (fast volume average − slow volume average) ÷ slow volume average. Its signal line smooths the oscillator, and its histogram is the oscillator minus the signal line. Specify the average types and lengths when testing it.
A reading of +20 means the fast volume average is 20% above the slow average. It does not mean the current bar is 20% above average, and it does not predict a bullish price move. Undefined or zero-baseline cases need explicit handling in a custom script.
OBV adds a bar’s volume when its close rises from the previous close, subtracts it when the close falls, and is unchanged when the closes match. Compare its swings with price without treating divergence as an automatic reversal signal.
Use LuxAlgo for Chart Context and Strategy Testing
LuxAlgo’s native platform combines charting with Quant for building indicators and strategies. On supported data, Volume Delta adds side-classified activity, while Volume Profiles show activity across price levels. Check data coverage and the selected profile type before comparing readings across markets.
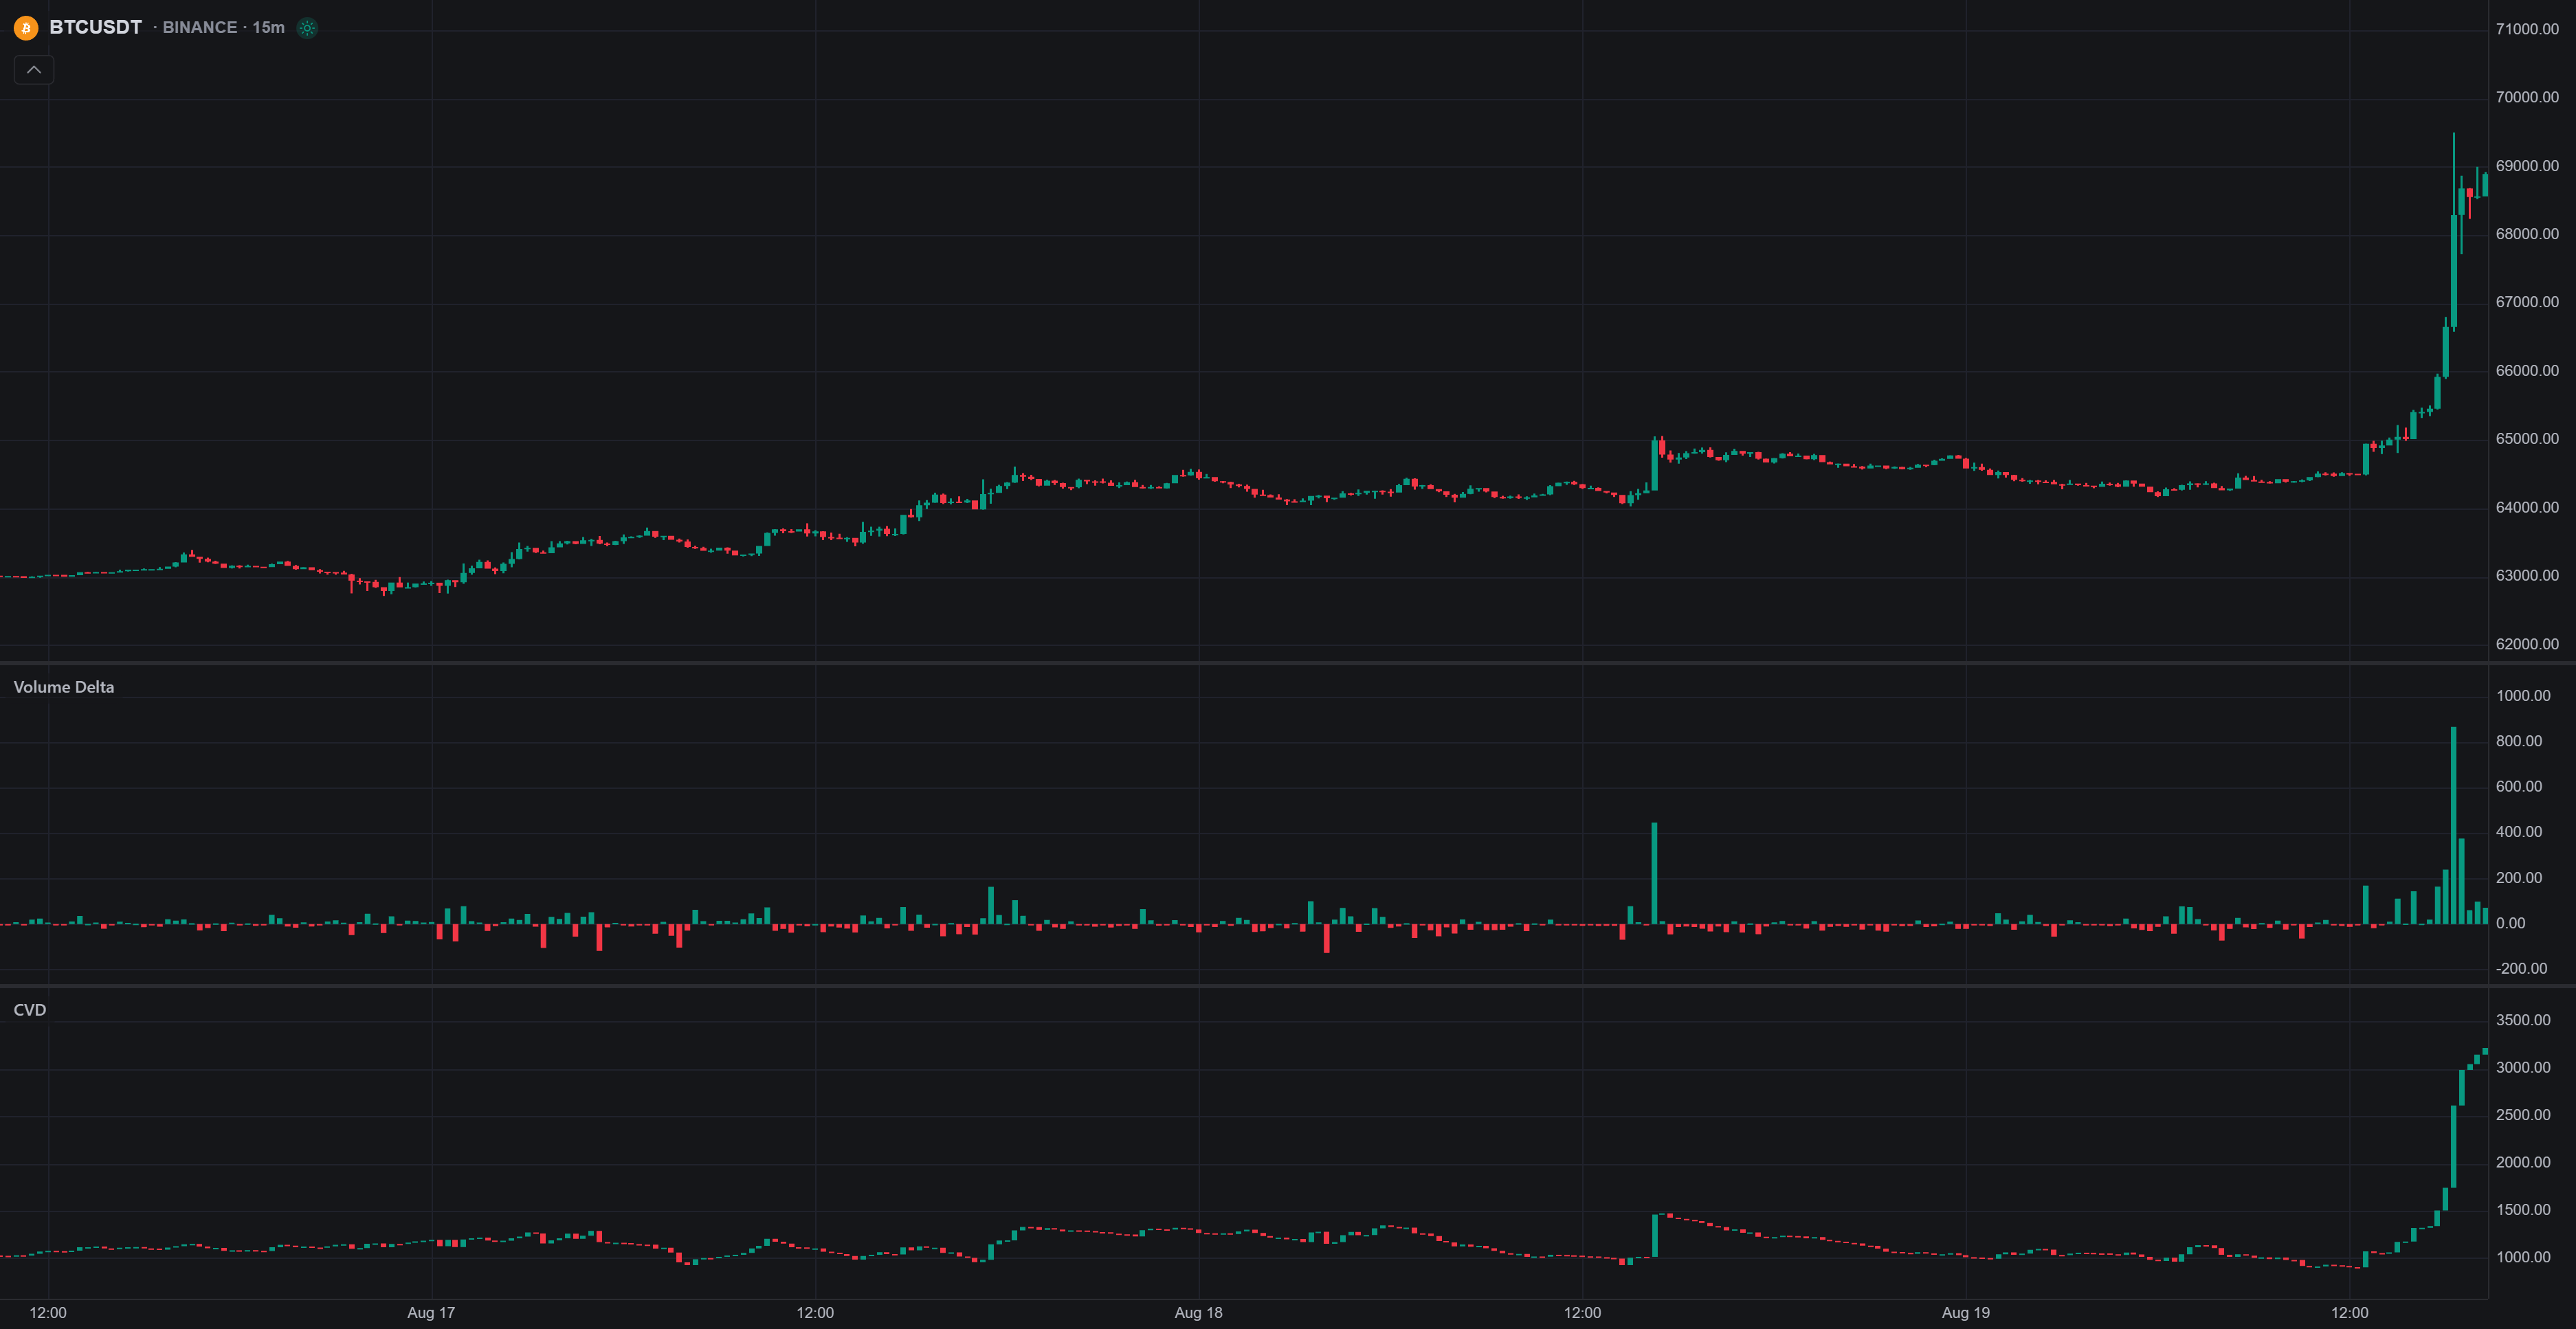
For a custom spike strategy, ask Quant to define the volume baseline, price trigger, signal timing, exit, and position-sizing rule. Review the code, then inspect native strategy results and properties with commission and slippage included. Test nearby thresholds and a later validation period; successful compilation is not proof of an edge.
Oscillator Matrix Is a Separate TradingView Toolkit
Oscillator Matrix® combines components such as HyperWave, Smart Money Flow, reversal signals, and confluence on TradingView. Its Money Flow thresholds describe oscillator conditions, not raw net executed buying or selling volume.
A threshold reading can become part of a defined toolkit setup, but it does not measure institutional conviction or guarantee that a breakout is real. Keep its supported alerts and conditions separate from native Quant features and do not assume a private toolkit calculation can be reproduced in a custom script.
Specify Alerts Precisely
These are example alert definitions to implement and test where your chosen platform supports them. They are not claims that every condition is a built-in LuxAlgo alert or scanner.
| Alert type | Example definition | Check |
|---|---|---|
| Absolute quantity | Completed 5-minute volume exceeds 200,000 shares | Units, symbol, and interval |
| Relative activity | Completed-bar volume exceeds twice the selected historical average | Baseline, lookback, and session matching |
| Price and volume | A completed close breaks the prior range high and meets the volume condition | The range excludes future bars and the entry timing is explicit |
Decide whether the alert fires on a threshold crossing or whenever the condition is true. Define bar-close versus intrabar behavior, repeat frequency, and reset conditions. Test with notifications before relying on the setup. An alert is a notification; execution requires a separately configured and verified order workflow.
Manage Event Risk and Trading Costs
Premarket, news-driven, and end-of-day activity should be interpreted in their own context. Opening or closing auctions, earnings, economic releases, and rebalancing can create spikes. Automatically avoiding all early or late activity is not a substitute for an explicit, tested session policy.
- Spread: Check the quoted spread and whether the expected move remains worthwhile after paying it.
- Slippage and impact: Fast markets or insufficient depth can produce worse execution than a chart suggests.
- Commissions and fees: Frequent entries and partial exits can increase total costs. Scaling does not inherently reduce turnover.
- Limit orders: They control the acceptable price but can remain unfilled or fill only partially.
- Stops: A stop can fill beyond its trigger; a stop-limit can fail to execute. Neither removes gap risk.
For a hypothetical $20 entry and $19.80 planned stop, price risk is $0.20 per share. A $100 risk budget with $0.05 per share allowed for estimated costs and adverse execution permits floor($100 ÷ $0.25) = 400 shares, or $100 planned risk. A move to $20.40 offers $0.40 gross reward per share; the same $0.05 cost allowance would reduce that to $0.35. Actual costs and fills can differ, so do not judge this scalp solely by its gross 2:1 price ratio.
Review the SEC’s stop-order guidance and limit-order definition when specifying execution rules.
Video: Comparing Unusual Volume
This Trade Nation + TradingView tutorial demonstrates a time-matched comparison. It helps explain the baseline used to judge unusual volume; its interface is separate from LuxAlgo’s native platform.
FAQs
How to trade volume spikes?
Define unusual volume against a comparable baseline, pair it with an explicit price trigger, and set entry, exit, and sizing rules. Test costs and failed signals rather than assuming every spike is an opportunity.
Does volume affect price action?
Volume records trading activity, while price movement reflects how orders interact with available liquidity. High activity can accompany an advance, a decline, or little net movement, so volume alone does not specify direction.
How to trade high volume?
Check the data, spread, depth, and event context first. Volume-by-price tools can show where activity occurred, but the trade still needs a price trigger and risk plan. Use realistic fills and costs when testing a high-volume strategy.
References
Read next