HTF Reversal Divergences
By LuxAlgoMar 11, 2026

The HTF Reversal Divergences [LuxAlgo] indicator is a multi-timeframe trading indicator built to help traders spot potential reversals with more context and less guesswork. It combines higher timeframe candle patterns, RSI divergence signals, and HTF PO3 candle projections into one practical workflow, making it easier to analyze trend exhaustion, momentum shifts, and possible turning points across different chart intervals. Whether you trade fast intraday charts or swing setups, this trading strategy tool helps connect lower timeframe execution with higher timeframe structure.
How to Trade the HTF Reversal Divergences Indicator?
This trading indicator is designed for traders who want to align entries with higher timeframe context instead of relying only on lower timeframe noise. By combining HTF reversal patterns with RSI divergence analysis, the indicator helps identify areas where a trend may be weakening and a reversal may be building.
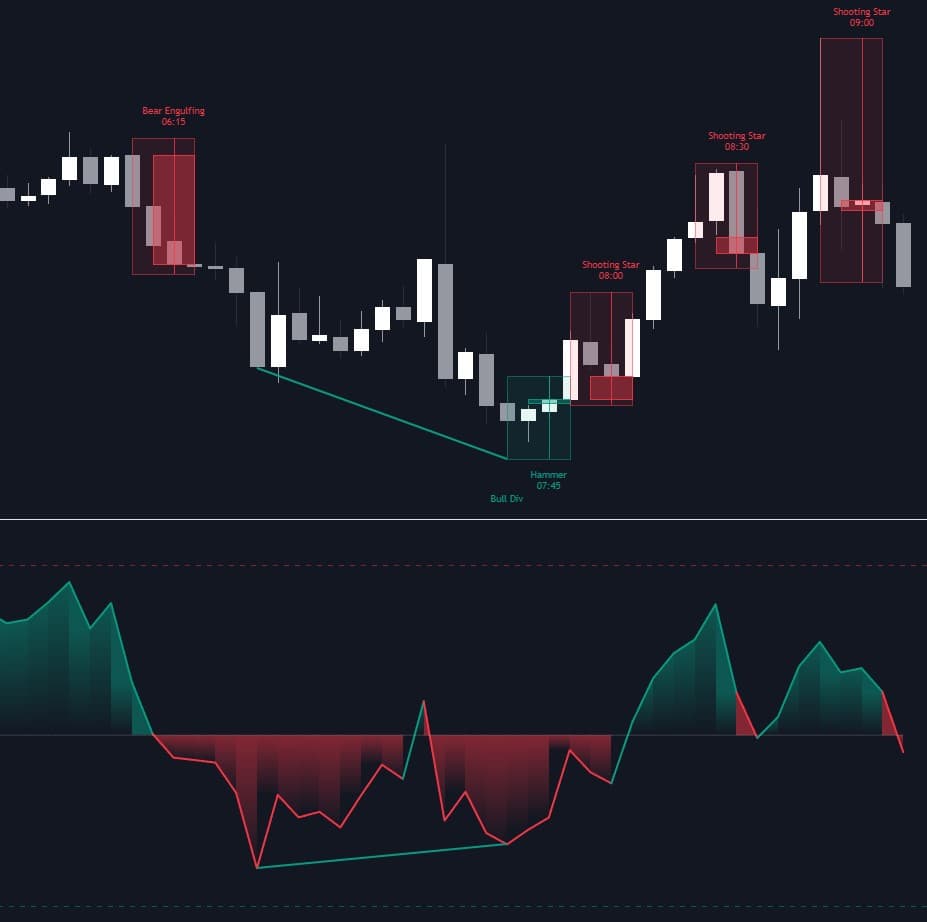
For example, traders can monitor a 1-hour or 4-hour candle structure while actively trading on a 5-minute or 15-minute chart. When a higher timeframe reversal pattern such as an engulfing candle or pin bar appears, the script marks that area directly on the chart with clear boxes and labels. This makes it easier to react to meaningful price action without constantly switching between chart intervals.
In practical use, traders may look for confluence between:
- A higher timeframe bullish or bearish reversal pattern
- A matching RSI divergence
- A projected HTF candle showing how the larger candle is developing in real time
- Local support, resistance, liquidity, or structure on the execution timeframe
This combination can make the indicator useful as both a reversal trading indicator and a broader trading strategy confirmation tool.
RSI Divergences Explained
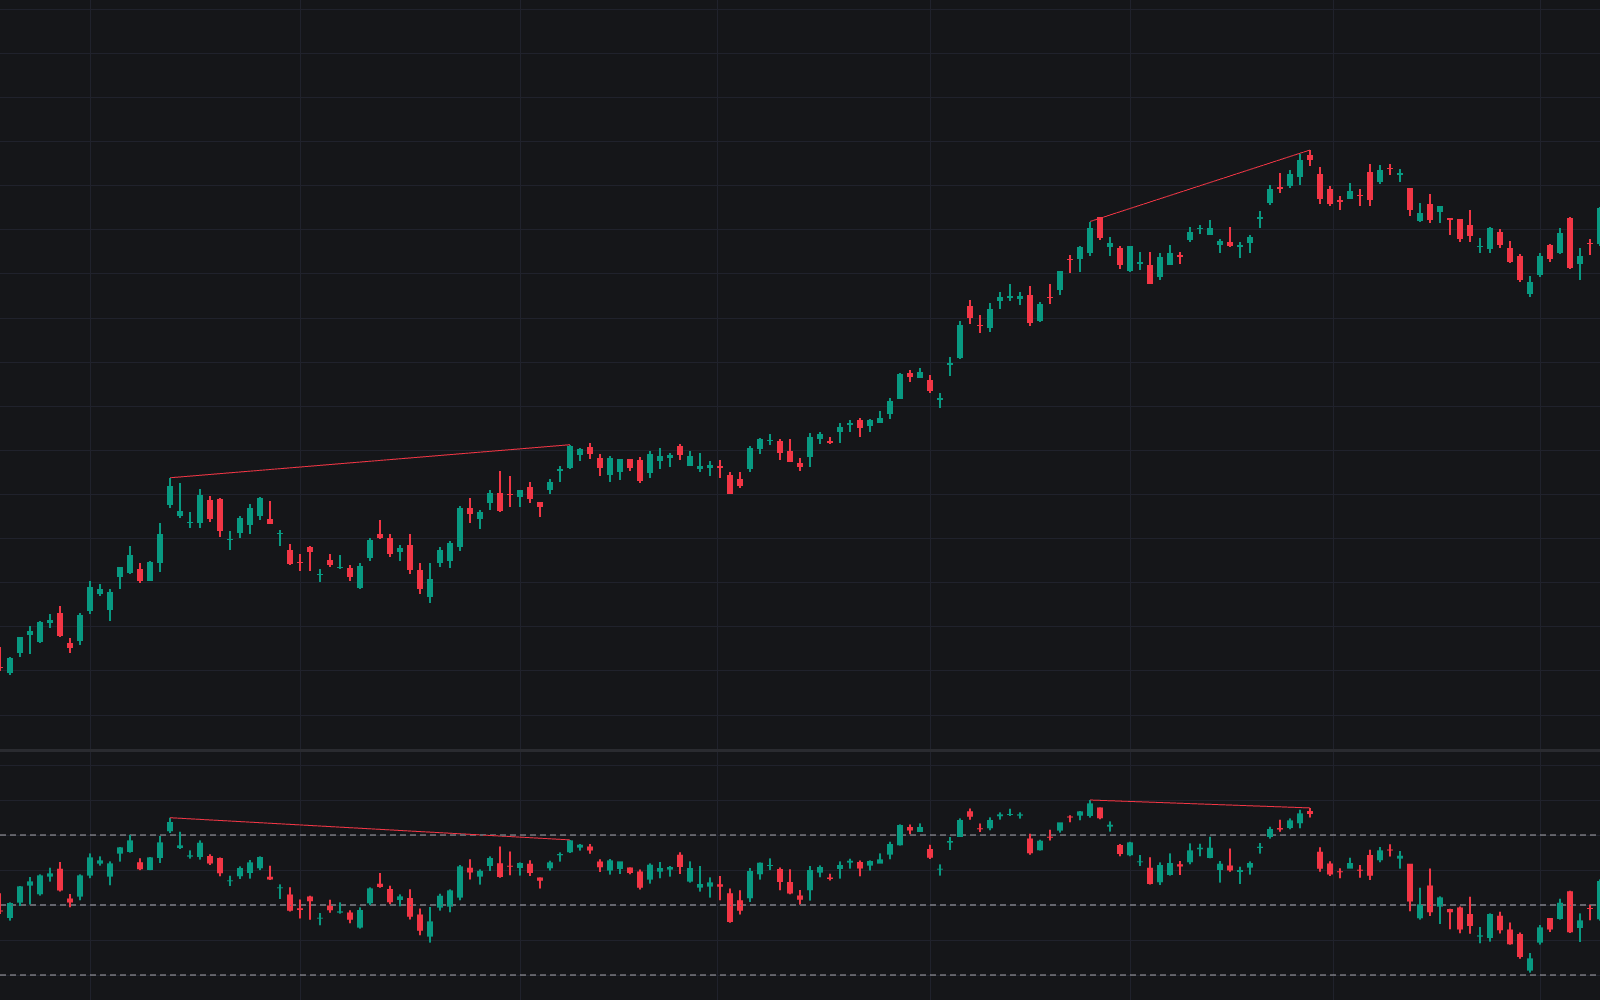
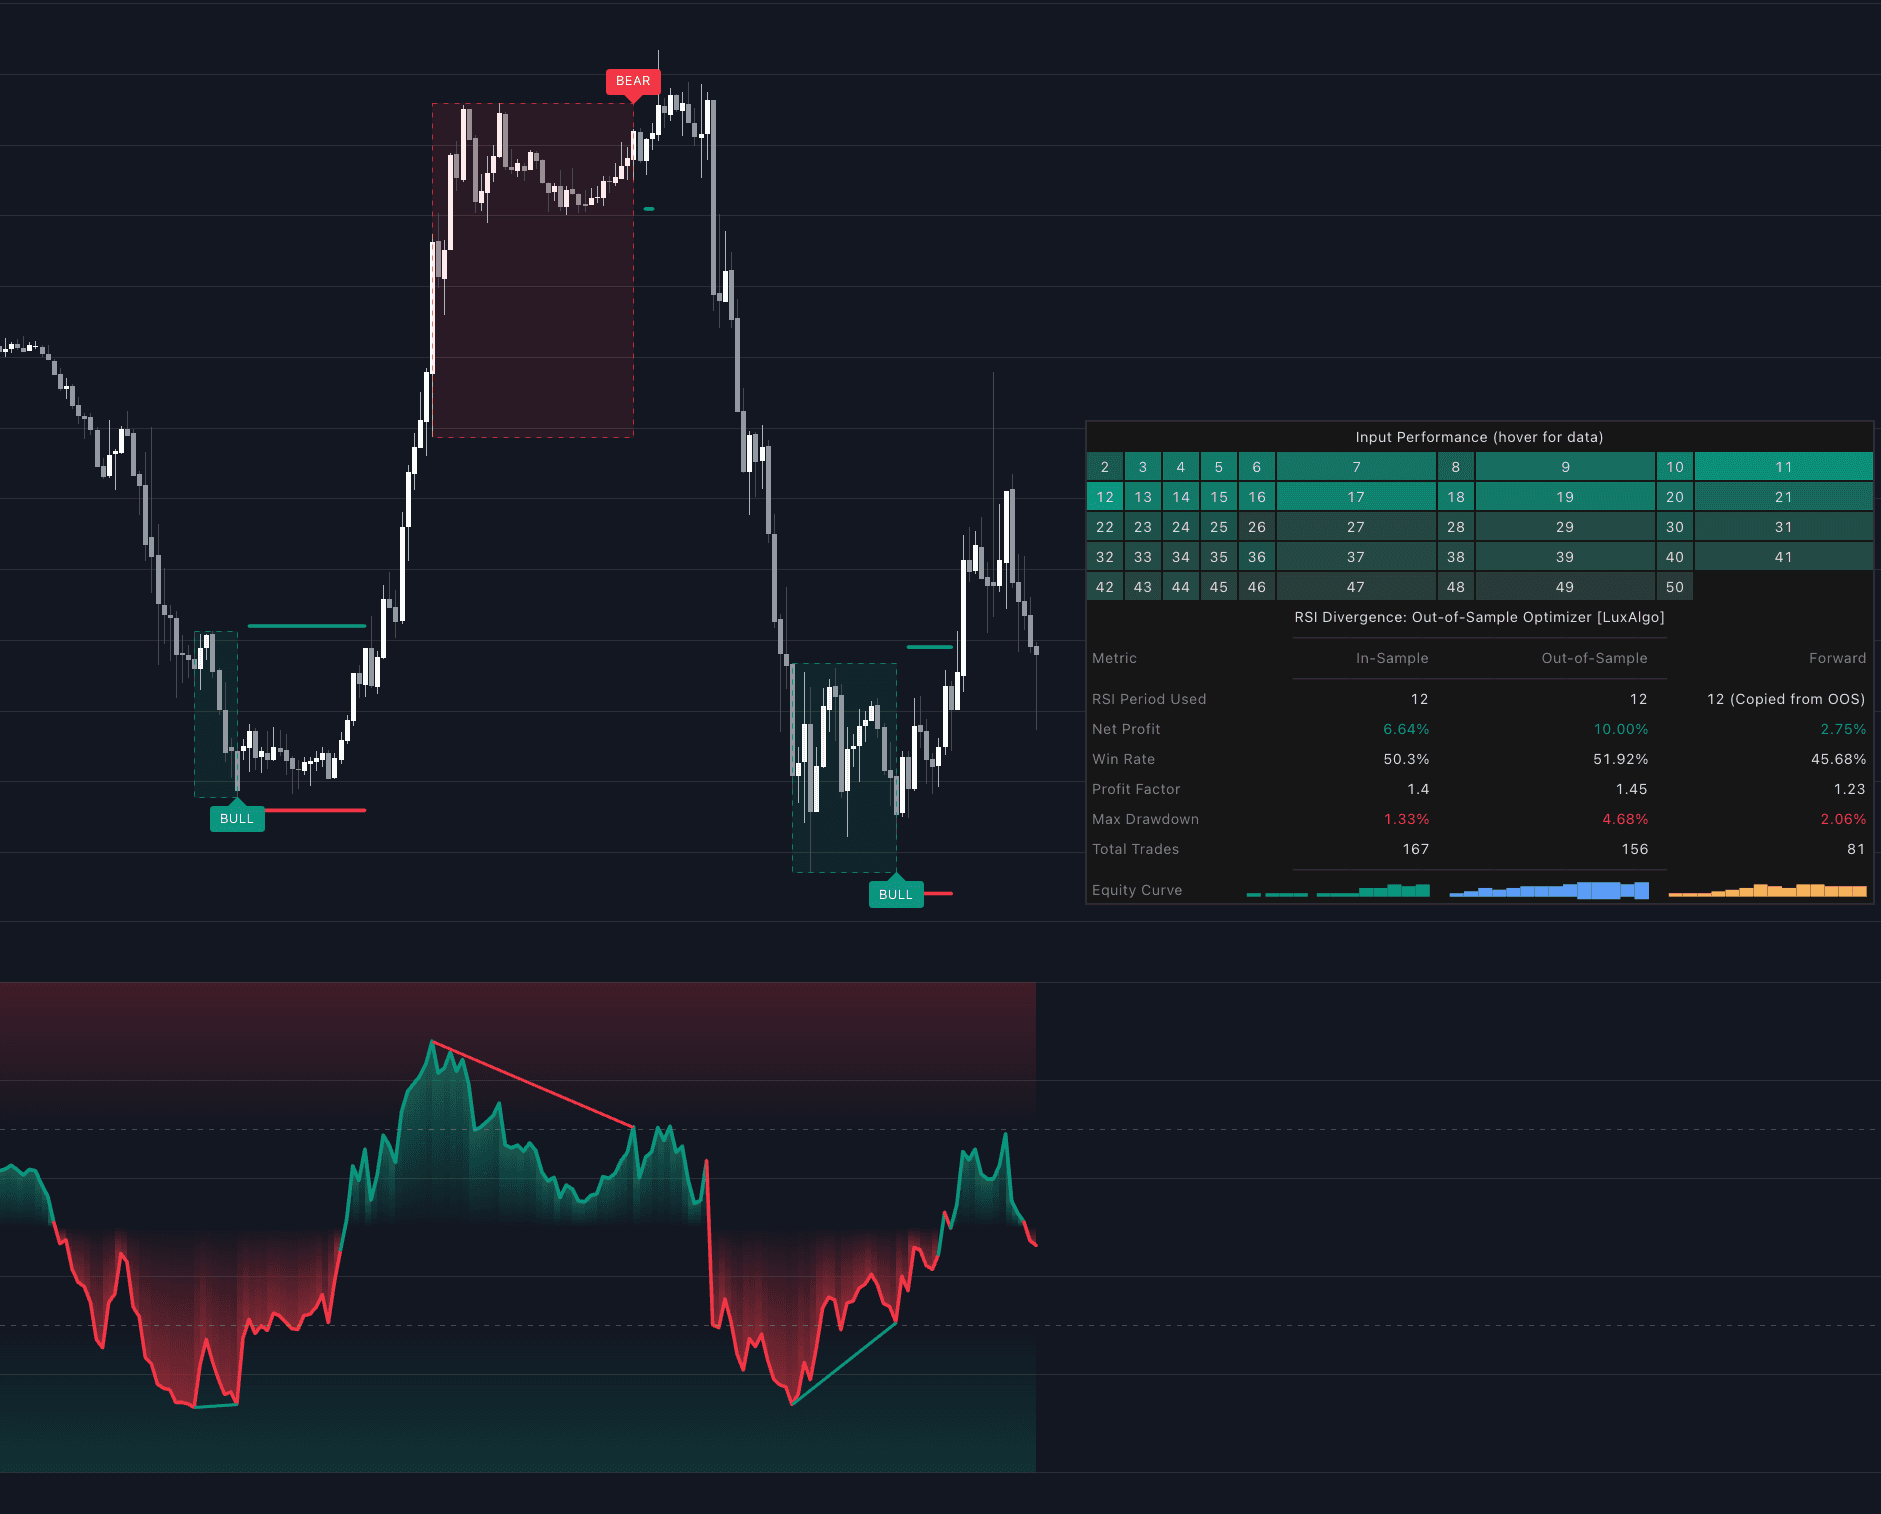
The indicator calculates the Relative Strength Index (RSI) and automatically detects regular divergence patterns. These are drawn on both the indicator pane and the main chart so traders can quickly compare momentum behavior with price action.
- Bullish Divergence: Forms when price prints a lower low while RSI prints a higher low, which can suggest bearish momentum is fading and a bullish reversal may be forming.
- Bearish Divergence: Forms when price prints a higher high while RSI prints a lower high, which can suggest bullish momentum is weakening and a bearish reversal may be developing.
RSI divergence is one of the most widely used momentum concepts in technical analysis because it can reveal hidden weakness in a move before price fully turns. When paired with higher timeframe candle signals, it becomes even more useful for traders looking to filter out lower-quality reversal setups.
Higher Timeframe PO3 Candle Projection
One of the standout features of this trading indicator is its Advanced HTF PO3 projection. Instead of forcing traders to imagine how a higher timeframe candle is forming, the script projects that candle to the right of live price action.
This allows traders to see the current state of the HTF candle’s:
- Open
- High
- Low
- Close
As lower timeframe bars continue to print, the projected candle updates live. This helps traders understand how intraday price action is contributing to the larger higher timeframe structure.
The PO3 view is especially helpful for traders who use concepts like accumulation, manipulation, and distribution. By seeing where the HTF open is relative to current price and whether the candle has likely already established its high or low, traders can better judge whether the market is expanding, stalling, or potentially reversing.
The projection also includes a Running Delta, which tracks volume-based buying and selling pressure during the active higher timeframe candle. Dashed guide lines connect projected OHLC levels back to the exact lower timeframe bars where those levels were formed, giving traders extra clarity on how the session structure developed.
Indicator Logic and Pattern Detection Details
The indicator uses request.security() to retrieve higher timeframe data from the timeframe selected by the user. This allows the script to overlay higher timeframe reversal logic directly onto a lower timeframe chart, which is ideal for traders who want multi-timeframe confirmation without manual chart switching.
The reversal patterns used by the indicator include:
- Engulfing Candles: A bullish or bearish candle that fully overlaps the previous candle’s body in the opposite direction, signaling a possible shift in control.
- Pin Bars: Includes hammers and shooting stars, defined by a wick that represents at least 60% of the candle’s total range, highlighting rejection and potential reversal pressure.
These pattern definitions help keep the signals structured and objective, which is useful for traders building a repeatable trading strategy around price action and momentum confluence.
The PO3 concept is also reflected in the live candle projection, helping traders visualize where the higher timeframe session began, how price has expanded away from the open, and whether the candle structure suggests continuation or exhaustion.
Indicator Settings and Customization
HTF Reversal Pattern Settings
These settings control the higher timeframe candle analysis and the way reversal signals appear on the chart.
- High Timeframe: Sets the higher timeframe used for reversal pattern detection and candle projection.
- Show Engulfing Patterns: Enables or disables bullish and bearish engulfing candle detection.
- Show Pin Bars: Enables or disables hammer and shooting star detection.
- Colors: Lets traders customize the look of bullish and bearish reversal zones and labels.
These controls are useful for adapting the indicator to different markets and trading styles, whether you prefer cleaner charts or more detailed reversal mapping.
RSI Divergence Settings
These inputs manage the momentum side of the indicator.
- Show RSI Divergences: Turns divergence detection on or off.
- RSI Length: Adjusts the RSI calculation period.
- Pivot Lookbacks: Controls the pivot sensitivity used to detect divergence points.
Traders can fine-tune these settings depending on whether they want earlier, more aggressive signals or cleaner, more selective divergence setups.
Advanced HTF PO3 Settings
These settings control the projected higher timeframe candle interface.
- Show HTF PO3: Enables or disables the PO3 candle projection display.
- Candles to Show: Sets how many historical higher timeframe candles appear next to the live projected candle.
- Right Offset: Controls how far to the right the projection is drawn.
- Show PO3 Price Labels/Delta: Toggles additional labels and Running Delta information on the projection interface.
This flexibility makes the tool useful for traders who want anything from a minimal higher timeframe view to a more advanced execution dashboard.
Why Traders Use This Trading Indicator
The HTF Reversal Divergences indicator can be especially valuable for traders who want a more complete framework for finding reversals. Instead of depending on a single signal, it combines three major forms of analysis:
- Higher timeframe price action patterns
- Momentum divergence through RSI
- Real-time HTF candle development through PO3 projection
This layered approach can help traders build better conviction, improve timing, and avoid chasing weak setups. It is useful for discretionary traders, price action traders, and anyone looking for a trading strategy that combines momentum, structure, and multi-timeframe analysis in one place.
FAQ
What is the HTF Reversal Divergences indicator?
It is a multi-timeframe trading indicator that combines higher timeframe reversal candles, RSI divergences, and projected HTF candle structure to help traders identify potential market turning points.
Who is this trading indicator best for?
It is useful for day traders, swing traders, and technical analysts who want to combine higher timeframe context with lower timeframe entries.
Does this indicator repaint?
Because the script uses higher timeframe data and live candle development, traders should understand that active higher timeframe candles are still forming until they close. Confirmed candle patterns are generally strongest after the higher timeframe bar completes.
How can traders use it in a trading strategy?
Many traders use it to look for confluence between HTF engulfing candles or pin bars, RSI bullish or bearish divergence, and nearby support or resistance. This can help improve reversal timing and trade filtering.
How do I access HTF Reversal Divergences?
You can get access on the LuxAlgo Library for charting platforms like TradingView, MetaTrader (MT4/MT5), and NinjaTrader for free.
Free indicator
Get free access to this indicator on the platforms below.
Unlock the entire LuxAlgo Library
Every indicator, every strategy, full charts, and complete access to Quant — our AI agent.