Intermarket Swing Projection
By LuxAlgoDec 10, 2025

The Intermarket Swing Projection trading indicator lets traders project swing structures from any external market directly onto their chart. By automatically rescaling the second asset’s price behavior using statistical normalization, it transforms complex intermarket relationships into clear, comparable zigzags and horizontal support-resistance levels. This creates a powerful framework for intermarket analysis, trend comparison, volatility studies, and multi-asset confluence detection—all in one tool.
Because the indicator adjusts for volatility differences and normalizes both assets to a common scale, traders gain a meaningful view of how two markets behave relative to each other, regardless of price range. This makes it a highly effective trading tool for identifying correlations, divergences, leading/lagging behavior, and structural similarities between assets.
How to Trade the Intermarket Swing Projection Trading Indicator?
This indicator operates by detecting swing points on both the chart’s primary asset and a second user-selected asset. Instead of simply overlaying prices, it converts the external asset into volatility-adjusted, rescaled swings that plot cleanly on the current chart. As a result, traders can perform more accurate intermarket comparisons and study behaviors such as trend alignment, structural divergence, and reaction to key zones.
You can select any ticker, timeframe, or swing sensitivity. The result is a flexible and highly customizable intermarket trading tool that behaves like a “Swiss army knife” for cross-asset analysis.
The three core parameters of Show Last, Pivot Length, and Spread determine the structural output:
- Show Last controls how many swing points to visualize.
- Pivot Length adjusts swing sensitivity, where higher values capture only broader market pivots.
- Spread widens or tightens support/resistance zones based on volatility expansion.
These settings allow traders to tune the indicator from micro-structure analysis to long-term trend-level comparisons.
Comparing Different Assets with the Indicator
This example compares Nasdaq 100 futures with four other futures contracts (S&P 500, gold, bitcoin, and EUR/USD), all displayed in Nasdaq-adjusted terms. Such comparisons reveal key intermarket dynamics:
- NQ vs ES: Nearly identical structure due to tech-heavy weighting in the S&P 500.
- NQ vs GC: Different momentum phases, including gold’s summer consolidation and later breakout.
- NQ vs BTC: Highlights bitcoin’s volatility and shifting market regime, including changing high formations.
- NQ vs 6E: Shows euro volatility within an uptrend and timing mismatches between NQ and currency swings.
This view provides traders with intermarket context that is usually hard to obtain with raw price overlays.
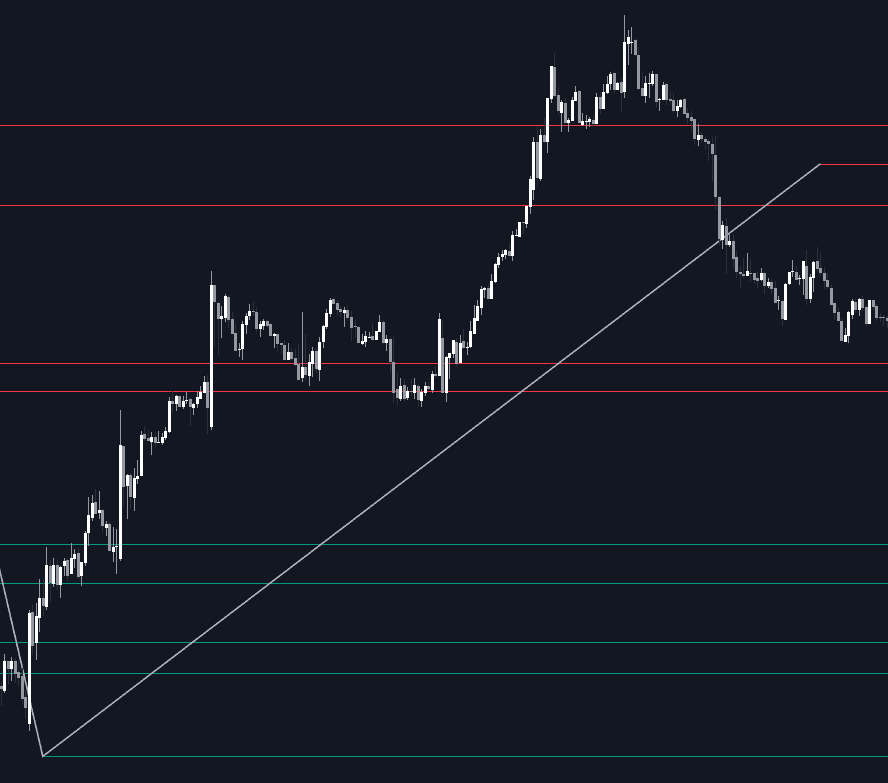
In a 1H timeframe example, horizontal levels act as dynamic support or resistance. Notice how NQ reacts to levels derived entirely from other assets’ swing behavior. This is a unique form of confluence rarely available through traditional indicators.
Display Modes & Trading Applications
The indicator includes two major display modes:
- ZigZag Swings: Displays the exact swing path and turning points of the external asset.
- Horizontal Levels: Extends key highs/lows forward in time, allowing traders to use them as support or resistance.
Traders can adjust level width via the Spread parameter to account for volatility.
Two color modes are available:
- Average Mode: Levels below the mean are bullish (green) and above it bearish (red).
- Pivot Mode: Swing lows are bullish (green) and swing highs bearish (red).
The optional Backpaint feature ensures swing plotting occurs at the correct historical location rather than at the moment of detection—important when analyzing past behavior.
How the Rescaling Works (Technical Breakdown)
To normalize two vastly different markets, the indicator computes:
- The average of all swing points on the chart asset
- The standard deviation of those swing points
- The z-score of each swing point from the external asset
The rescaled range is then given by average + z_score × standard_deviation.
This mathematical transformation allows, for example, AAPL’s price swings to be projected into Nasdaq 100 equivalent terms. By converting swings into normalized volatility units, any two assets can be analyzed on equal footing—making the indicator extremely powerful for intermarket trading strategies.
Settings
Trendlines
- Ticker: Choose the external market to project.
- Timeframe: Apply a separate timeframe for swing detection.
- Show Last: Number of displayed swing points.
- Pivot Length: Controls swing sensitivity.
- Spread: Adjusts volatility-based spacing for support/resistance.
- Backpaint: Toggle historical vs. real-time swing visualization.
Style
- Show ZigZag: Display or hide swing paths.
- Show Levels: Display or hide horizontal levels.
- Color Mode: Choose Average or Pivot mode for level coloring.
- Bullish/Bearish Colors: Customize appearance.
- ZigZag Color: Select the swing-line color.
FAQ
What can I use the Intermarket Swing Projection indicator for?
To compare trends, swings, volatility behavior, and structural reactions between two assets on equal terms, making it ideal for intermarket analysis and multi-asset confluence trading.
Is this indicator suitable for swing traders or intraday traders?
Yes. By adjusting Pivot Length and Timeframe, the tool scales effortlessly from micro swings to large market cycles.
Does the spread setting change the recalculation?
No. Spread only expands or contracts the projected horizontal levels. It does not influence swing detection.
How do I access the Intermarket Swing Projection indicator?
You can get access on the LuxAlgo Library for charting platforms like TradingView, MetaTrader (MT4/MT5), and NinjaTrader for free.
Free indicator
Get free access to this indicator on the platforms below.
Unlock the entire LuxAlgo Library
Every indicator, every strategy, full charts, and complete access to Quant — our AI agent.