All indicators

Volume Bubbles & Liquidity Heatmap

By LuxAlgoSep 17, 2025

Static chart image
Dynamic OverlaysSupport and ResistanceVolume BasedLiquidationLiquidity

The Volume Bubbles & Liquidity Heatmap indicator is a powerful trading tool designed to give traders a clearer picture of volume dynamics and liquidity distribution across multiple timeframes. By combining dynamic volume bubbles with a liquidity heatmap, this indicator makes it easy to identify areas of price interest, spot market imbalances, and improve decision-making for both scalpers and swing traders.

This trading indicator is ideal for volume traders, price action traders, and liquidity-focused traders who need a clean, multi-dimensional view of buyer/seller activity and the zones where market participants are most active. With full customization over bubble display, timeframes, and visual settings, traders can tailor the tool to fit virtually any trading strategy or market.

How to Trade with the Volume Bubbles & Liquidity Heatmap Trading Indicator?

indicator image

The goal of this trading strategy tool is to provide a simple but highly effective visual framework for analyzing volume per price, spotting shifts in buying vs selling pressure, and detecting liquidity accumulation zones.

By default, the indicator displays buy/sell volume bubbles based on a daily timeframe, plotted across the last 2,000 bars. However, the chart timeframe and the bubble timeframe are independent—this is key for multi-timeframe analysis.

Traders can also enable the liquidity heatmap to see how volume is distributed across price levels, making it easier to identify support, resistance, and liquidity voids.

Volume Bubbles: Interpreting Market Momentum with Precision

The volume bubbles feature offers three modes of analysis:

  • Total Volume: Shows the combined buy and sell volume per bubble.
  • Buy & Sell Volume: Visual split of buying vs selling activity.
  • Delta Volume: Displays the net difference between buy and sell volume—critical for assessing directional bias.

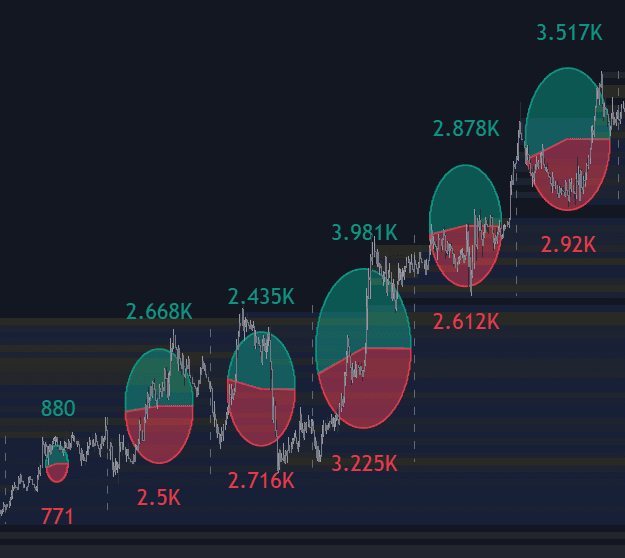
Each bubble corresponds to a selected timeframe (e.g., daily, weekly), and the size of the bubble reflects total volume: larger bubbles = higher volume.

Color coding provides instant context:

  • Green: Buy volume dominates
  • Red: Sell volume dominates

indicator image

This makes it easy to identify transitions in market strength, divergence in volume vs price, and probable continuation or reversal zones.

indicator image

To get the most accurate bubble display, it's recommended to use a lower chart timeframe and a higher bubble timeframe. For example, viewing weekly bubbles on a 1-hour chart creates more visual separation and clarity.

Liquidity Heatmap: Spot the Price Zones That Matter

indicator image

The liquidity heatmap divides the chart into configurable horizontal rows and calculates the total trading volume in each price zone. This enables traders to quickly pinpoint where liquidity is building, drying up, or reacting to price.

Key customization parameters include:

  • Rows: Number of price divisions
  • Cell Minimum Size: Minimum pixel size per liquidity cell
  • Colors: Red (high liquidity), Yellow (moderate), Blue (low)

indicator image

By observing price behavior around highly liquid cells (red), traders can anticipate potential support/resistance, price rejection zones, or breakout opportunities.

Combining Volume Bubbles with Liquidity Heatmap for Trade Confirmation

This tool shines when both components are used together.

The volume bubbles help you understand who is in control—buyers or sellers—while the liquidity heatmap tells you where the market is likely to react. Together, they form a comprehensive trading strategy framework.

indicator image

In the example above, we see Delta Volume Bubbles on a BTC 1H chart, showing buyer/seller dominance per week. Traders can correlate these bubbles with liquidity levels to confirm entries, exits, or trend continuation.

Some insights from the chart:

  • When strong buyers are present (green delta), and price holds above liquidity zones, upside continuation often follows.
  • If price trades into high liquidity with negative delta (strong sellers), a reversal becomes more likely.
  • Watching the shift in delta from week to week offers a directional edge.

Current bubble (week 17) shows a weakening of sellers compared to the previous week, hinting at a possible bullish reversal.

indicator image

The image above shows price rejection at a key liquidity zone—this often signals an ideal entry or exit.

Timing trades around these zones helps traders filter false breakouts, catch reversals early, and validate trend strength.

Indicator Configuration Details

Volume Bubble Customization

indicator image

You can fully customize the appearance and functionality of the volume bubbles:

  • Mode: Choose between total volume, buy/sell split, or delta.
  • Timeframe: Set the timeframe of each bubble (e.g., 1D, 1W).
  • Size %: Control the overall bubble size.
  • Shape: Adjust the vertical stretching to fine-tune readability.

indicator image

Fine-tuning Size% and Shape ensures that the bubbles remain legible across different assets and chart scales.

You can also toggle on/off labels and timeframe separators for added clarity.

Settings Overview

General

  • Execute on last X bars: Define how many bars back the tool processes.

Volume Bubbles

  • Display Bubbles: Toggle on/off.
  • Bubble Mode: Choose between Total, Buy/Sell, or Delta.
  • Bubble Timeframe: Select desired timeframe.
  • Bubble Size %: Adjust bubble sizing.
  • Bubble Shape: Vertical stretching factor.

Labels

  • Display Labels: Toggle label visibility, adjust size & placement.

Separators

  • Display Separators: Enable/disable visual dividers between bubble periods.

Liquidity Heatmap

  • Display Heatmap: Enable/disable heatmap view.
  • Heatmap Rows: Define the number of horizontal price divisions.
  • Cell Minimum Size: Set minimum size of each cell.
  • Colors: Customize color mapping for high/medium/low liquidity zones.

Style

  • Set custom colors for Buy/Sell volumes and other visual elements.

FAQ

What trading strategies does the Volume Bubbles & Liquidity Heatmap indicator support?
This tool supports multiple strategies including volume delta divergence, breakout confirmation, support/resistance rejections, and institutional liquidity mapping. It’s highly effective for scalping, swing trading, and intraday setups.

What assets can I use this indicator on?
You can use it on any asset class: stocks, crypto, forex, commodities, and indices. It works especially well on high-volume assets like BTC, ES, NQ, AAPL, and others.

How do I access the Volume Bubbles & Liquidity Heatmap indicator?
You can get access on the LuxAlgo Library for charting platforms like TradingView, MetaTrader (MT4/MT5), and NinjaTrader for free.

Why is my volume bubble not showing properly?
Make sure the chart timeframe is significantly lower than the bubble timeframe (e.g., chart on 1H and bubble set to Daily or Weekly). Also, check that there are enough bars in view and adjust your bubble size or shape if necessary.

Can I use the heatmap without the bubbles?
Yes, you can toggle each feature on or off in the settings panel. You can choose to use just the liquidity heatmap or just the volume bubbles independently.

Is it repainting?
No, the indicator does not repaint. It uses historical volume data and fixed logic for calculating bubbles and liquidity zones.

Free indicator

Get free access to this indicator on the platforms below.

TradingView
NinjaTrader
MetaTrader 4/5

Unlock the entire LuxAlgo Library

Every indicator, every strategy, full charts, and complete access to Quant — our AI agent.