Concept
Intermarket Analysis
Intermarket Analysis, also known as bonds→stocks→commodities sequence, copper/gold, oil-FX, are Breadth, Sentiment & External Data concepts. The Library holds 1 implementation, a working definition you can pull into Quant.
Murphy
Top Intermarket Analysis indicator
The top custom implementation, built on the original standard Intermarket Analysis formula.
1 total
This Intermarket Analysis implementation is strategy-ready: open it in Quant, set your rules, and it backtests automatically.
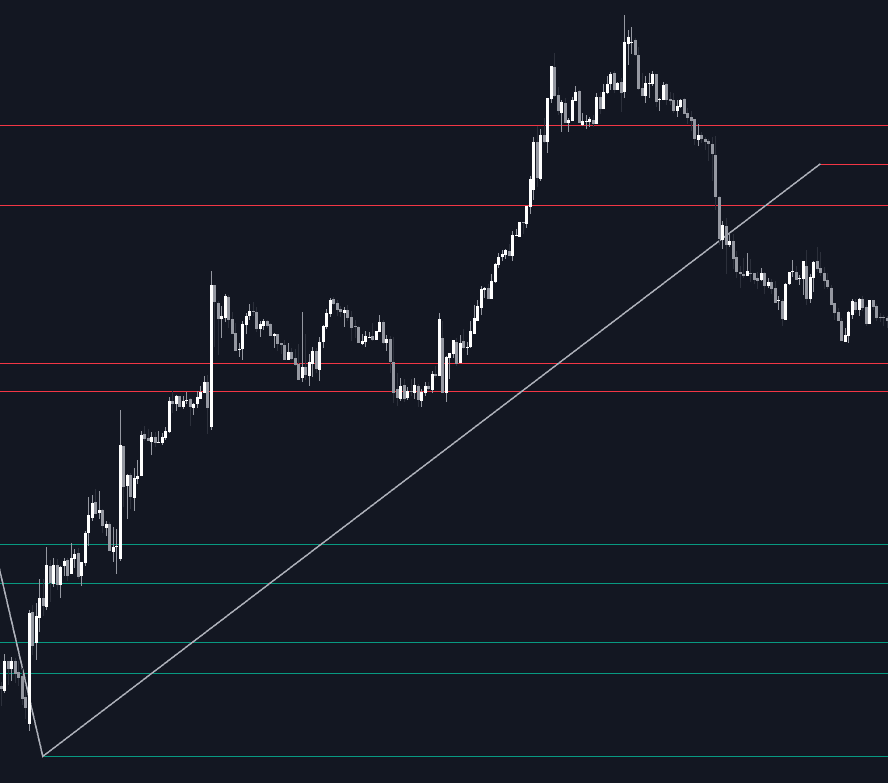
What is Intermarket Analysis?
Intermarket analysis is the practice of reading the four major asset classes (currencies, bonds, stocks, and commodities) as one linked system rather than in isolation. John Murphy codified the framework: in the classic business-cycle sequence, bonds tend to turn before stocks and stocks before commodities, the dollar tends to move inversely to commodities, and ratios like copper/gold serve as growth proxies that often track bond yields. The working toolkit is simple: ratio charts, correlation studies, and watching which market is leading.
Murphy laid the framework out in Intermarket Technical Analysis (1991), with the 1987 crash as his motivating case: a falling bond market and rising commodities preceded the October collapse in stocks. He revised the model in Intermarket Analysis (2004) after the deflationary shocks of the late 1990s broke the old bond-stock linkage. The revision is itself part of the lesson: even the author treats the relationships as tendencies to re-examine, not fixed machinery.
The essential caveat is regime dependence. The stock-bond correlation was broadly positive through the inflationary decades, broadly negative through the disinflationary 2000s and 2010s, and shifted again when inflation returned. Lead-lag distances stretch and compress, so the textbook relationships are hypotheses to verify in current data, not laws.
Modern practice extends the toolkit: the volatility complex through the VIX and implied volatility, futures positioning through open interest, and breadth measures such as advance/decline internals that check whether the index agrees with its components. Crypto joins as a further asset class: bitcoin's coupling to equities and the dollar comes and goes by regime, and crypto cycle models apply the same rotation logic to an asset with its own seasons.
How to run an intermarket check on your charts
The aim is a repeatable circuit of comparisons around the market you trade, not one magic overlay.
- 1Chart the anchor market you trade beside its natural counterparts: for an equity index, the 10-year yield, the dollar index, credit spreads, and a commodity benchmark.
- 2Express the relationships as ratios or relative strength comparisons, stocks against bonds or copper against gold, so leadership shows as a trending line.
- 3Measure rolling correlations of returns over a window matched to your horizon, recording the current sign and strength instead of assuming the textbook ones.
- 4Look for divergence at the turns: an anchor market at new highs while its confirming markets stall or roll over is the classic intermarket warning.
- 5Re-run the circuit on a schedule and after macro shocks; the relationships that held last quarter are what a new regime breaks first.
How traders use it
- As a context filter: before trusting an equity breakout, traders check whether yields, the dollar, and credit are telling a compatible story; conflict across markets argues for smaller size or more patience.
- As a leadership watch: turns in rate-sensitive markets are monitored for early warning on equities per the classic sequence, with the understanding that lead times are irregular and sometimes absent.
- As rotation input: cross-asset ratios (stocks versus bonds, copper versus gold, growth versus defensives) feed allocation decisions; sector rotation models apply the same cycle logic inside the equity market, and dollar linkages get the same treatment in FX work.
- For currency work: commodity currencies are read against their exports, the oil-sensitive Canadian dollar and Norwegian krone being standard examples, with a currency strength meter condensing which leg of a pair is moving.
- As the within-market analog: breadth gauges such as the percentage of stocks above their 200-day average play the same confirming role inside an index that bonds and the dollar play across assets.
Intermarket analysis vs related concepts
Ratio Charts: The tool versus the framework. A ratio chart is how a single intermarket relationship gets drawn; intermarket analysis is the discipline of choosing which ratios matter, reading them together, and noticing when a relationship changes regime. One is an instrument, the other the argument built from it.
Relative Strength Comparative: Same arithmetic, different scope. RS comparative typically benchmarks a stock or sector against its index to find leaders within one market; intermarket analysis points the same comparison across asset classes to infer the macro backdrop. The chart looks identical; the question differs.
Advance/decline Internals: Confirmation from inside versus outside. A/D internals ask whether the average stock supports the index's move; intermarket work asks whether bonds, the dollar, and commodities support the equity story. They fail independently, so the checks pair well.
Concept family
Breadth, Sentiment & External Data
63 concepts mapped · 63 in the Library
Intermarket Analysis FAQ
Turn Intermarket Analysis into a trading strategy.
Take the implementation from this page into Quant, then build on it, backtest it on real data, and keep refining it in conversation.