Overnight vs Intraday Returns
 By LuxAlgoOct 9, 2026
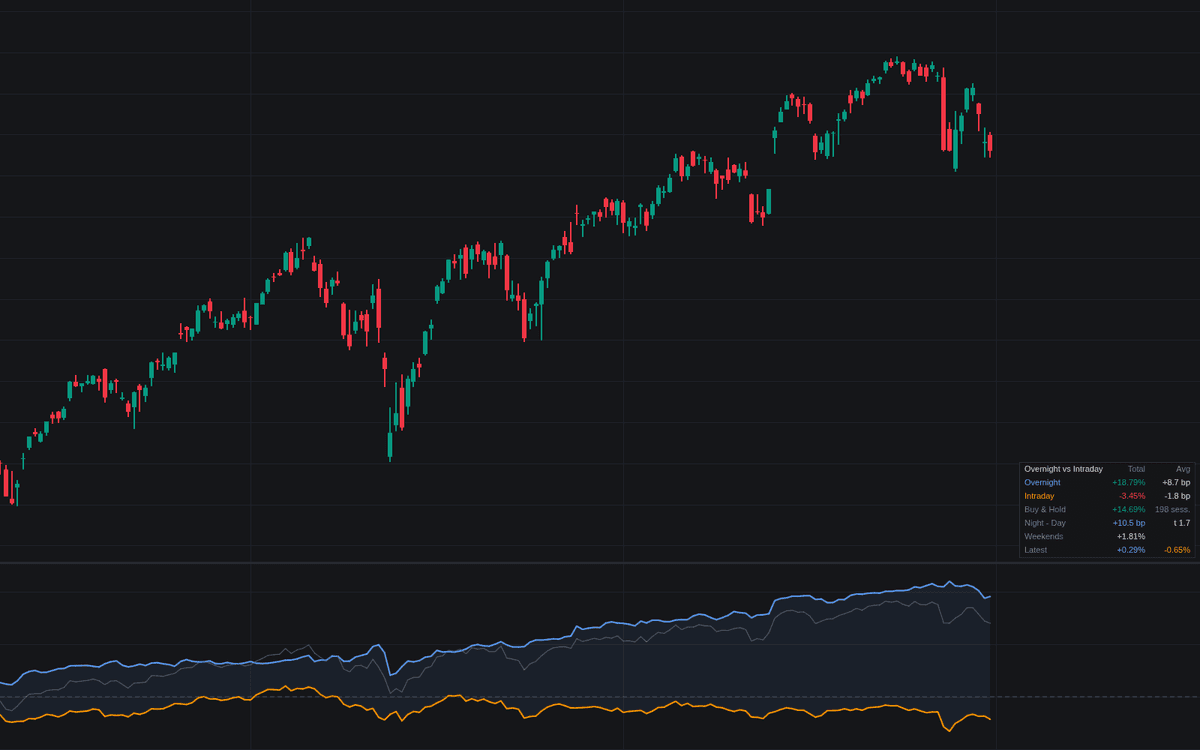

Overnight vs Intraday Returns tracks and compares performance between two distinct market segments: the overnight gap, spanning from the previous close to the current open, and the intraday session, spanning from the current open to the current close. By decoupling these two time periods, traders can identify market inefficiencies, evaluate the impact of off-market news or overnight sentiment versus intraday volatility, and optimize their holding strategies for specific time-of-day biases.
How to Trade the Overnight vs Intraday Returns?
To effectively utilize this indicator, focus on observing which "leg" contributes more to the total performance of an asset. If an asset shows a consistently positive overnight return, it suggests a potential "gap-and-go" bias or significant demand during off-market hours. Conversely, a strong intraday return suggests that the asset is driven by active participation during regular market hours.
Traders can use the dashboard to assess the statistical significance of these differences via the t-statistic provided. Comparing the "Night - Day" spread helps determine if the asset consistently performs better while the primary exchange is closed or during active trading hours. The visual boxes on the price chart allow you to identify the specific price movement of each leg session by session, providing a clear context for where profit or loss originated in recent price action.
Overnight vs Intraday Returns Settings
Return Split
- Regular Session: Defines the specific hours for the intraday session, including the start and end times for open and close calculations.
- Timezone: Sets the timezone for the session logic, ensuring the data aligns correctly with the local exchange.
- Return Scale: Choose between Compounded (the actual percentage return) or Log (mathematically additive returns where overnight and intraday sum to the total buy and hold).
- Statistics Window: Sets the number of completed sessions for the dashboard calculations. Using 0 includes all available sessions.
- Buy & Hold Line: Enables or disables the cumulative plot of both legs combined on the chart.
Legs On Price
- Show Legs On Price: Displays visual boxes on the price chart representing the overnight gap and the intraday session.
- Leg Returns: Prints the specific return percentage next to each box for quick reference.
- Sessions Kept: Adjusts how many recent sessions retain their visual boxes on the price chart.
Dashboard
- Show Dashboard: Toggles the visibility of the detailed statistical panel.
- Position: Controls the corner of the chart where the dashboard is anchored.
- Size: Adjusts the scale of the dashboard text.
Style
- Overnight/Intraday/Buy & Hold: Custom color settings for each return path to ensure visual clarity.
Frequently Asked Questions
Free on Vela
Run it on Vela. Go further with a paid plan.
- Up to 500 strategy alerts, with webhook automation
- Up to 10× the chart history of Free
- Orderflow lookback up to full history
- Up to 100,000 monthly credits for Quant to customize it
- Futures data alongside crypto, stocks, forex and commodities

Run it on Vela. Make it yours with Quant.
Open this indicator free on Vela, our next-generation charting platform. Then ask Quant, our coding agent built into Vela, to retune it or turn it into a backtested strategy of your own.