Volume by Time
 By LuxAlgoSep 3, 2025
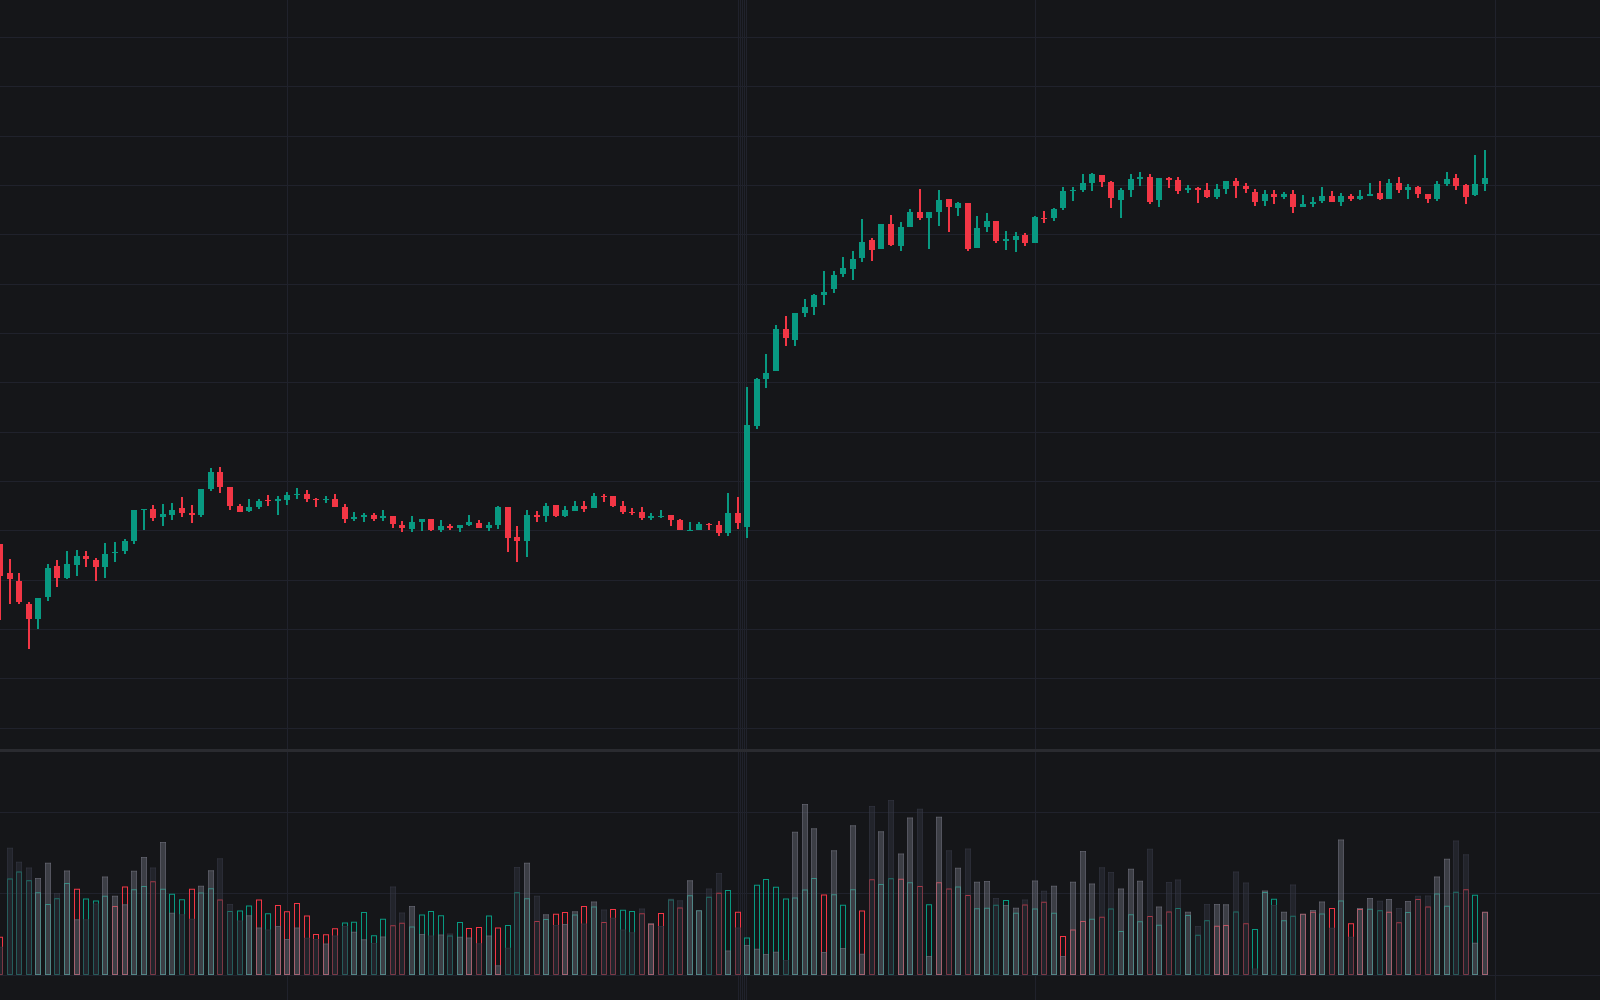

Volume by Time learns when your market is normally busy. Every bar's volume is stored against its exact time of day, and as sessions accumulate the indicator computes the typical participation for each slot: time-of-day effects made visible. On the chart, hollow bars show the historical norm at every timestamp and solid bars show the current session, so unusual activity announces itself the moment it prints.
How to Trade the Volume by Time?
- Solid bar overtaking its hollow baseline: participation running above normal for that time of day, elevated relative volume of the kind that accompanies breakouts and momentum.
- Solid bars persistently under the baseline: a quieter-than-usual session, where moves carry less conviction.
- Bi-directional split: separates upward from downward volume per slot, exposing which side is driving an anomaly.
- Median baseline: the robust choice when a few outlier days would otherwise distort the norm.
The indicator reports how many days feed the baseline; the count can vary slightly during a session as partial data rolls in, which is expected. A Length of 0 uses the full history for maximum context, while shorter windows keep the baseline tuned to recent behavior.
Volume by Time Settings
- Analysis Type (default Average): Average smooths noise but follows outliers; Median resists one-off volume spikes.
- Length (Days): how many past days build the baseline; 0 uses all available data.
- Bi-Directional Toggle: splits the histogram into upward and downward volume.
Frequently Asked Questions
Free indicator
Get free access to this indicator on the platforms below.

The Library is free. Quant makes it yours.
Pull any concept or indicator into Quant: rebuild it, retune it, or turn it into a backtested strategy of your own.