PDH/L FVG (CRT)
 By LuxAlgoAug 11, 2026
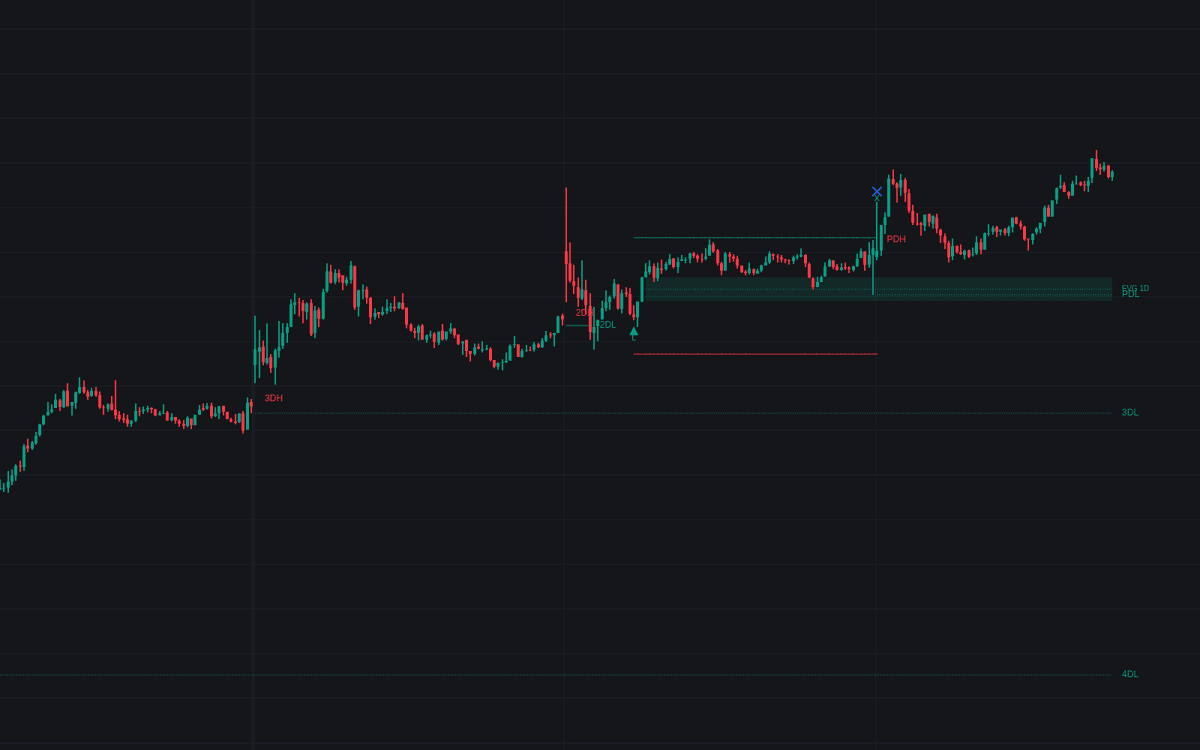

The PDH/L FVG (CRT) indicator identifies key liquidity levels from previous daily highs and lows and combines them with Fair Value Gaps (FVG) to pinpoint potential institutional trading entries. By monitoring how price interacts with historical daily boundaries, this tool provides a systematic approach for traders to capture trend continuations following liquidity sweeps.
Usage
The PDH/L FVG (CRT) is designed to help traders execute strategies based on ICT inspired concepts of liquidity sweeps and market imbalances. To use this tool effectively, wait for the price to sweep a Previous Day High (PDH) or Previous Day Low (PDL). Once a sweep occurs, the indicator looks for a qualifying Fair Value Gap (FVG) to emerge within the specified window of bars.
- Market Sweep Confirmation: When price action violates a daily high or low, the indicator flags the event, signaling that liquidity has been harvested and a reversal or trend continuation is possible.
- Entry Timing: You can choose between immediate entry upon FVG formation or a more conservative approach that waits for a 50 percent retest of the FVG midpoint.
- Trend Filtering: Enable the Exponential Moving Average (EMA) filter to ensure that signals align with the broader market direction, reducing the likelihood of trading against the primary trend.
Details
This indicator functions by programmatically tracking daily high and low data using security requests. It maintains these levels as horizontal lines on the chart, which automatically update as new days begin. When a price bar crosses these historical levels, the script identifies a sweep event.
The FVG detection engine scans for three candle imbalances where price momentum creates a gap that is not filled by the wicks of the surrounding candles. By applying a volatility filter using the Average True Range (ATR), the script ensures that only significant market imbalances are highlighted. Once a signal is active, the script calculates dynamic stop loss and take profit levels based on customizable ATR multipliers, providing a complete risk management framework directly on your chart.
Settings
Levels
- Days to keep: Determines how many historical daily high and low levels are plotted on the chart.
- Line width: Adjusts the thickness of the PDH and PDL lines for better visual clarity.
- High/Low color: Customizes the color used for daily high and daily low lines.
FVGs
- Show FVGs: Toggles the display of bullish and bearish fair value gaps.
- Maximum FVGs: Sets the upper limit for the number of gaps visible at any given time.
- Use volatility filter: When enabled, ignores minor gaps that do not meet the minimum size requirement defined by the ATR.
- FVG ATR length: Defines the lookback period for the ATR calculation used in the volatility filter.
- Minimum gap / ATR: Sets the sensitivity threshold for the size of the FVG relative to the current volatility.
- Keep filled FVGs: If enabled, maintains a visual record of gaps even after price has filled them.
- Show 50% lines: Draws a midpoint line through each FVG to visualize potential entry retest zones.
Signals
- Enable long/short signals: Toggles trade signals for the respective directions.
- Invert signals: Reverses the logic to turn long signals into shorts and vice versa.
- Entry timing: Selects between entering immediately on FVG formation or waiting for a 50 percent retest of the FVG midpoint.
- Bars allowed after sweep: Specifies the maximum time window following a sweep in which a valid FVG signal can trigger.
- Trade ATR length: The lookback period for calculating ATR based stop and profit targets.
- Stop loss/Take profit ATR multiple: Adjusts the distance of the exit targets relative to the volatility of the asset.
Trend Filter
- Use EMA trend filter: Restricts signals to only those that align with the direction of the EMA.
- EMA period: The lookback length for the trend detection EMA.
FAQ
Q: How do I access the PDH/L FVG (CRT)? A: It is free on the LuxAlgo Library. From this page you can open it on Quant Charts, load it into Quant, our coding agent, to run or backtest it, or copy the source code and run it anywhere Pine Script® runs.
Free indicator
Get free access to this indicator on the platforms below.

The Library is free. Quant makes it yours.
Pull any concept or indicator into Quant: rebuild it, retune it, or turn it into a backtested strategy of your own.