Candle Range Theory
Candle Range Theory, also known as CRT, Candles are Ranges Theory, CRT model, is a Smart Money Concepts / ICT concept. The Library holds 3 implementations, each one a working definition you can pull into Quant.
Top Candle Range Theory indicators
The top custom implementations, built on the original standard Candle Range Theory formula.
3 total
Every Candle Range Theory implementation here is strategy-ready: open one in Quant, set your rules, and it backtests automatically.
What is Candle Range Theory (CRT)?
Candle Range Theory (CRT) treats every candle as a range: its high and low are the boundaries, its midpoint is equilibrium, and the stops resting beyond either extreme are liquidity the next candles may reach for. The core model is a three-candle sequence on one timeframe. Candle 1 sets the range. Candle 2 trades beyond one of candle 1's extremes and closes back inside: the manipulation. Candle 3 is expected to deliver toward the opposite extreme: the distribution. A bullish CRT sweeps candle 1's low and closes back above it; a bearish CRT mirrors that at the high.
The model grew out of the Smart Money Concepts and ICT community in the 2020s and spread through social media and community scripts, some of which credit it to a trader known online as Romeotpt (also 'Raid') and expand the acronym as 'Candles are Ranges Theory'. Its three acts are the accumulation-manipulation-distribution template laid across three consecutive candles instead of inside one. Because it is taught rather than published, details vary by teacher: which timeframes count, whether one large candle containing several smaller ones can serve as the range, and how the entry is confirmed.
The close of candle 2 is the test. A wick beyond the range that closes back inside says the break found no acceptance on that timeframe: stops beyond the extreme were filled, breakout entries are under water, and the far side of the range becomes the obvious draw on liquidity. A close beyond the extreme says the opposite, and the CRT is void in that direction. Everything else in the model exists to filter, because a candle trading through the previous candle's high or low and closing back inside is an everyday event on any chart.
CRT is applied top-down. The range candle is read on a higher timeframe (monthly through 1-hour are all in use) and candle 2 is watched on a lower one, where the sweep plays out as a run beyond candle 1's extreme followed by a market structure shift back inside. Practitioners give most weight to a candle 2 that sweeps into a higher-timeframe key level, such as an old high or low, an order block or a fair value gap, and treat a CRT in open space as weak.
How to identify a Candle Range Theory setup
The bullish case is described; mirror every step for a bearish CRT at candle 1's high.
- 1Choose the range timeframe and mark candle 1's high and low (wicks included) and its 50% level.
- 2Wait for candle 2 to trade below candle 1's low, filling the sell-side stops beneath the range.
- 3Require the close: candle 2 must close back above candle 1's low. A close below it cancels the bullish CRT.
- 4Time the entry on a lower timeframe, commonly 15-minute to 1-hour against a daily range: late in candle 2 once structure shifts back inside, or in candle 3 after the close confirms. Common triggers are a change in state of delivery or a fair value gap left by the move back inside.
- 5Place invalidation beyond candle 2's low and map the targets: candle 1's 50% level first, candle 1's high as the full objective.
How traders use it
- As a daily framework: with yesterday as candle 1, a sweep of the previous day's low that reverses back inside turns the prior period levels into a plan aimed at the previous day's high.
- As an intraday session model: one widely shared variant takes the 1 AM 4-hour candle as the range, watches whether the 5 AM candle sweeps it, and executes on the 15-minute chart.
- As a risk template: stop beyond the manipulation extreme, partial at candle 1's midpoint, and the opposite extreme as a liquidity-pool profit target.
- As bias for other models: an active higher-timeframe CRT sets direction for lower-timeframe entries such as the Silver Bullet, and rules out trades against it until the CRT completes or fails.
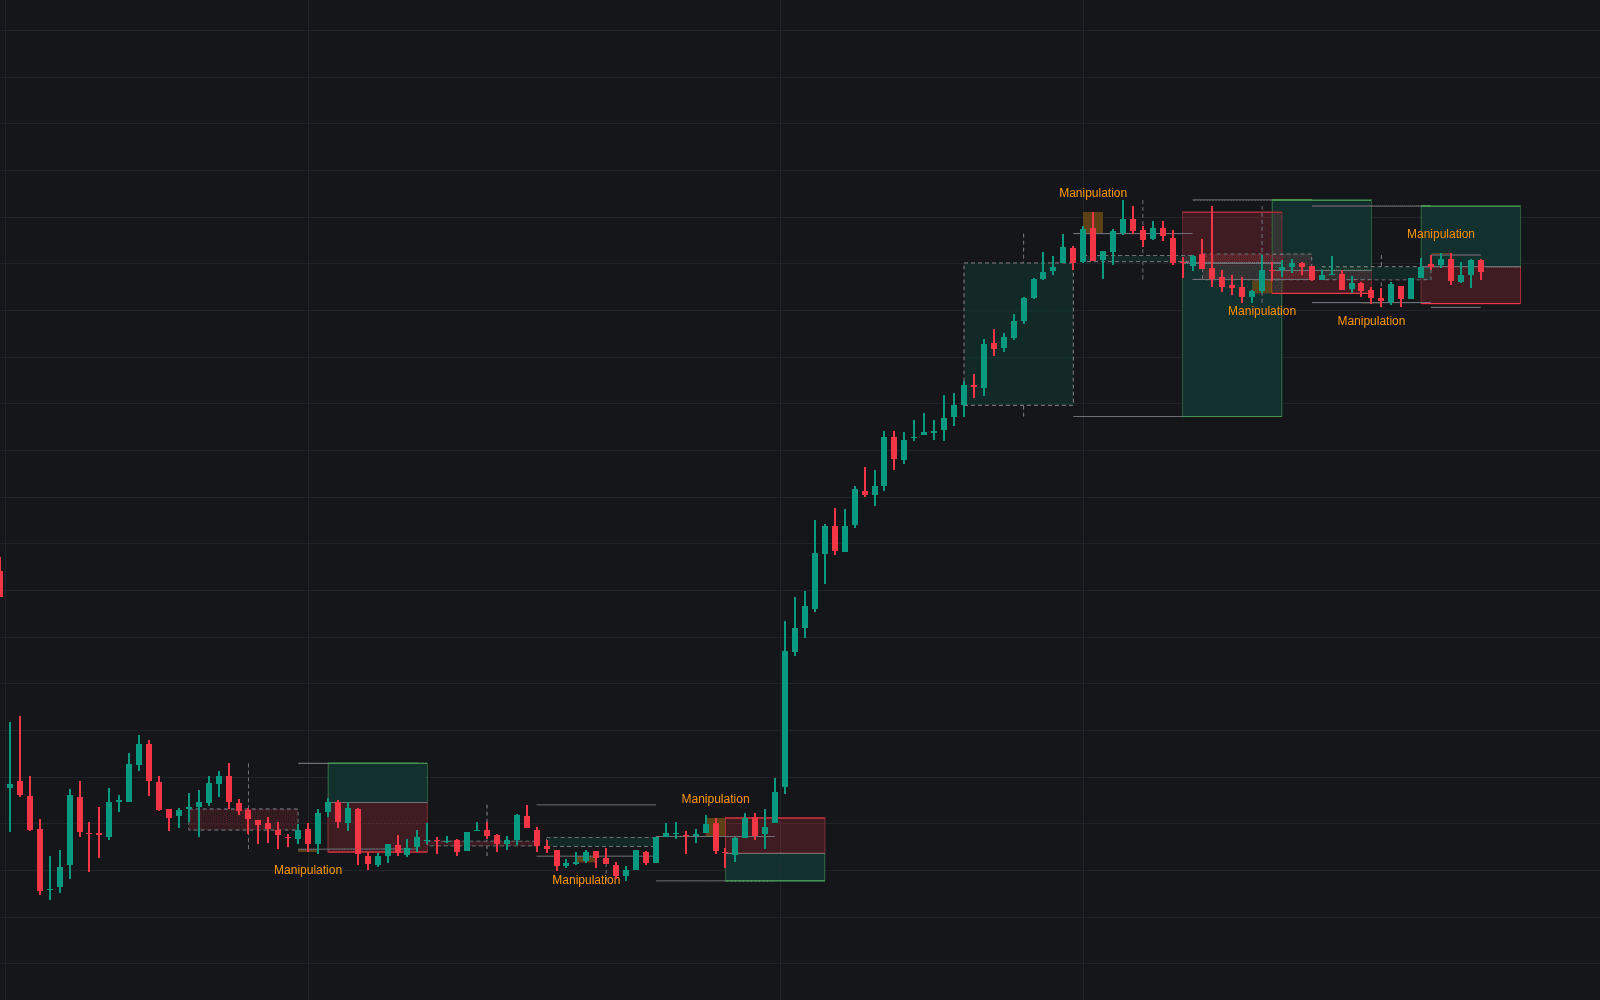
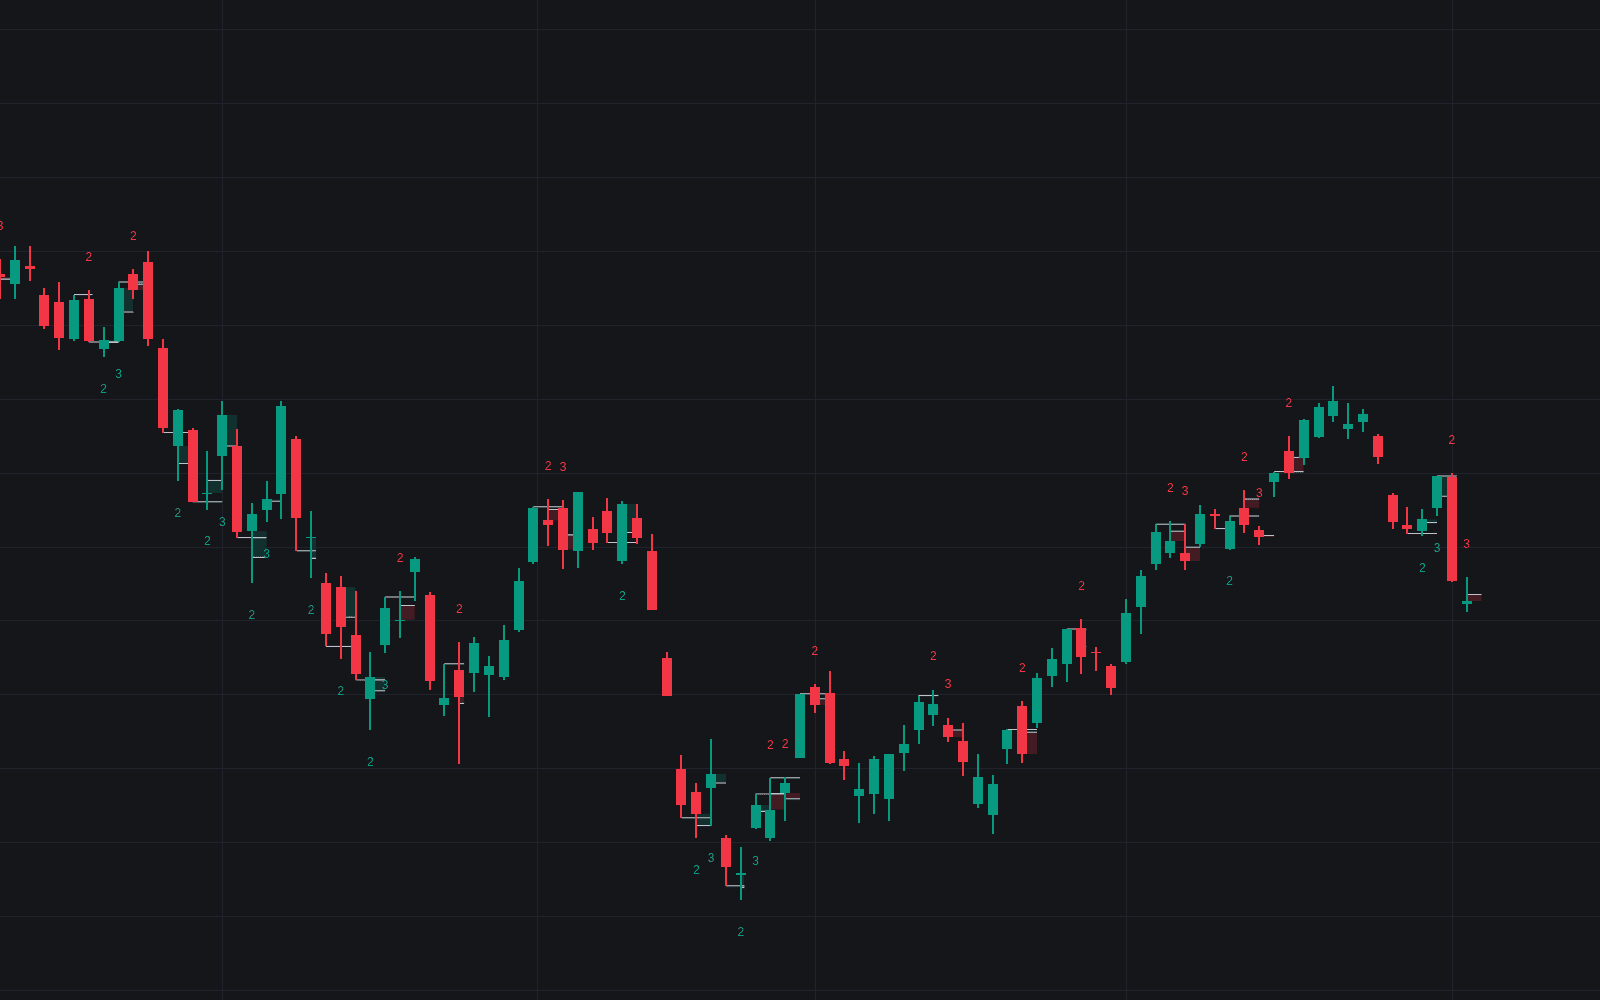
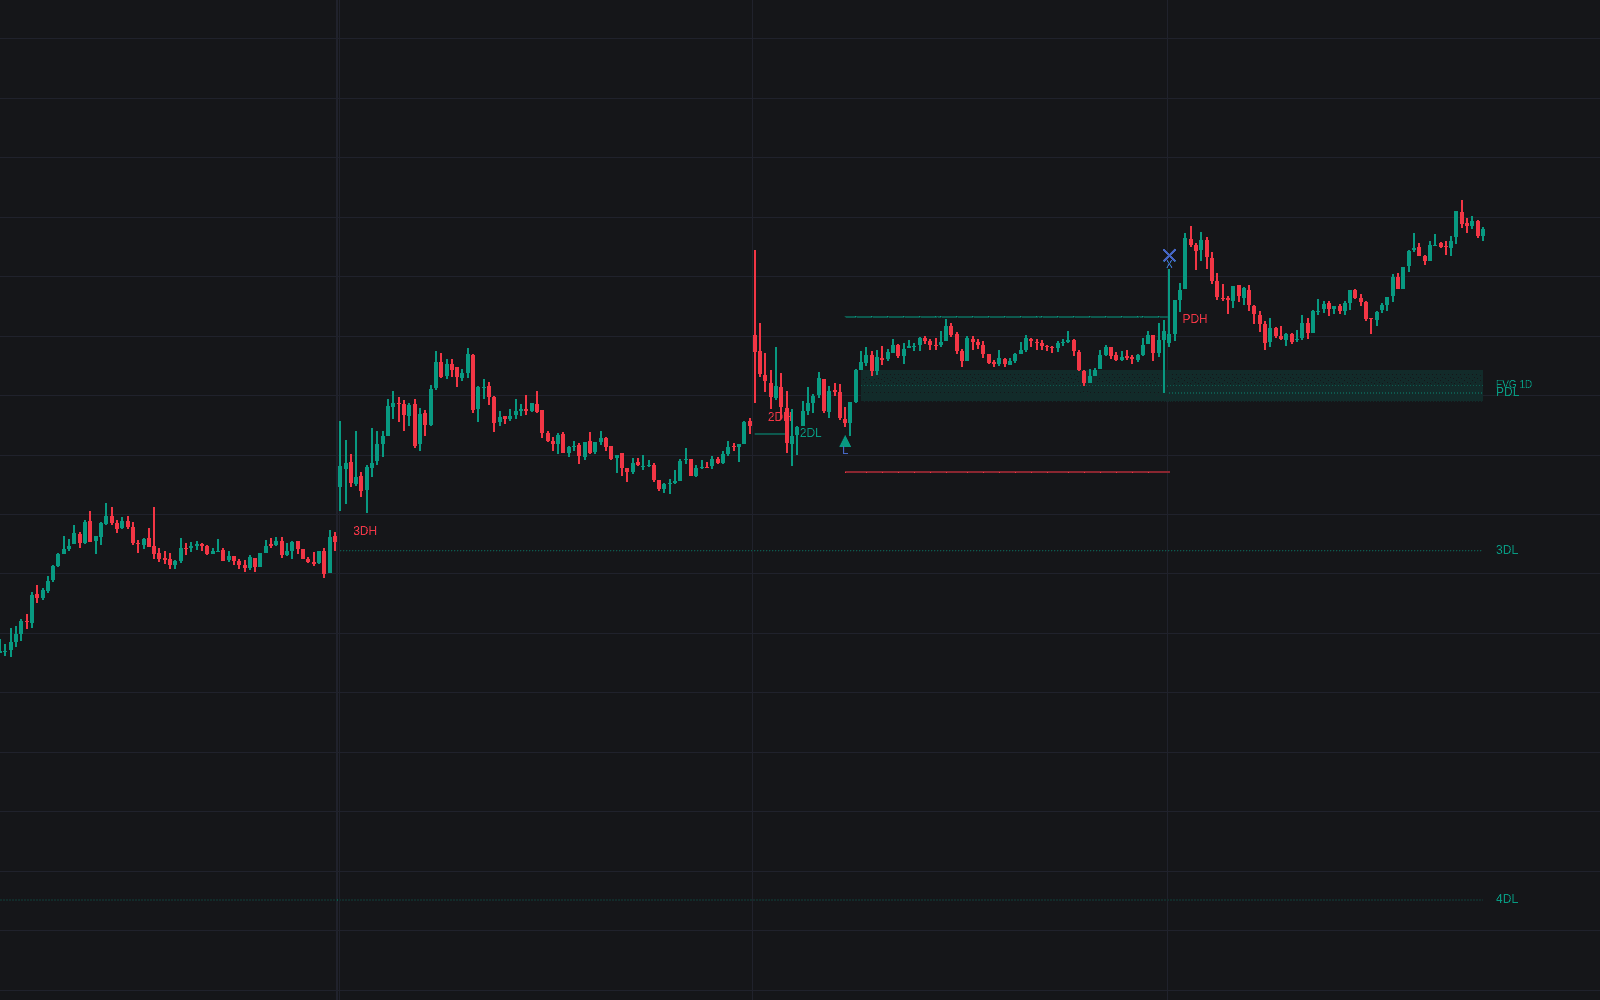
- In LuxAlgo builds: CRT Sweep & Setup Highlighter draws the previous higher-timeframe candle, boxes a 'Manipulation' event when a chart bar trades beyond its high or low and closes back inside, and after a fair value gap or structure-shift confirmation projects the stop at the sweep extreme and the target at the candle's opposite extreme. HTF Sweep Signals marks completed higher-timeframe candles that ran the prior candle's extreme and closed back through its close; Candle 2 Closure labels the candle 2 and candle 3 conditions on the chart's own timeframe.
Candle Range Theory vs similar concepts
Liquidity Sweep: A sweep is the generic event: a run through any level where stops rest, followed by failure. CRT is a model built on one specific sweep, the raid of a candle's high or low, and adds a defined range, a confirmation rule (candle 2 closes back inside), a delivery window (candle 3) and a built-in target (the opposite extreme). Every CRT contains a sweep; most sweeps are not CRTs.
Turtle Soup: Connors and Raschke's turtle soup fades a fresh 20-day extreme whose prior extreme is at least four sessions old, entering on a stop back inside the old range. CRT's reference is one candle's range, usually the previous one, and its confirmation is that timeframe's close rather than an intrabar stop entry. In CRT teaching the two often stack: the higher-timeframe CRT supplies direction, a lower-timeframe turtle soup the entry.
Deviation Above/below Range: A deviation works the boundary of an established, multi-touch range and judges acceptance over time and several closes. A CRT needs no prior tests: the range is one candle, and acceptance is settled by one close on that candle's timeframe. The rotation toward the far side is shared; the range definition and the confirmation clock are not.
Accumulation-manipulation-distribution: Power of Three reads its three acts inside one candle, anchored to the open. CRT spreads them across three candles, with the previous candle's extremes in place of the open as the reference.
Concept family
Smart Money Concepts / ICT
55 concepts mapped · 55 in the Library
Candle Range Theory FAQ
Turn Candle Range Theory into a trading strategy.
Take any implementation from this page into Quant, then build on it, backtest it on real data, and keep refining it in conversation.