Period Opens
 By LuxAlgoOct 9, 2026
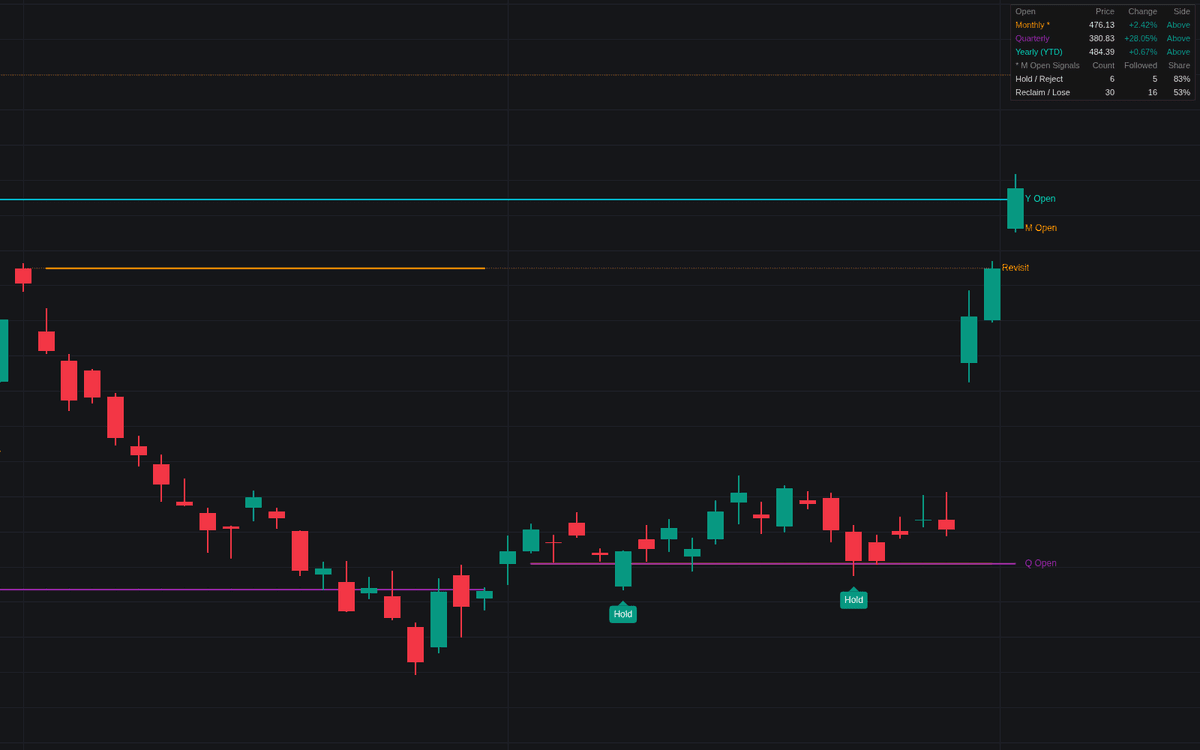

Period Opens is a sophisticated technical analysis tool that automatically plots the opening prices of fixed time intervals such as daily, weekly, monthly, quarterly, and yearly cycles. By visualizing these foundational levels, traders gain a clear reference for market sentiment and institutional interest. The indicator helps identify potential support and resistance zones while highlighting structural shifts when price moves between these critical opening points. Whether you are performing intraday scalping or multi-week swing analysis, these levels provide a consistent framework for understanding where price has established its baseline for different temporal segments.
How to Trade the Period Opens?
The primary utility of this indicator lies in identifying price behavior relative to specific time cycles. When price remains above a period open, the market is exhibiting bullish behavior for that timeframe, often treating the level as a support zone. Conversely, trading below an open suggests a bearish outlook where the level acts as resistance.
Traders look for four distinct interactions:
- Holds and Rejects: These occur when price tests the open level and bounces, suggesting the level is successfully defending the current trend.
- Reclaims and Loses: These happen when price closes through the level, indicating a potential reversal or shift in market bias.
- Untested Opens: The indicator tracks levels that price has not visited since the start of the period. These often act as liquidity magnets and can provide high probability entry or exit opportunities when price eventually returns to them.
- Confluence: When multiple period opens align closely, such as a weekly open meeting a monthly open, they create a stronger support or resistance cluster that often results in more significant market reactions.
Period Opens Settings
Periods
- Periods Shown: Select Auto to match the indicators to your current chart view, or Custom to manually pick which specific periods appear on your screen.
- Daily/Weekly/Monthly/Quarterly/Yearly: Individual toggles to enable or disable specific period levels and choose their distinct display colors.
Untested Opens
- Track Untested Opens: When enabled, the indicator keeps lines on the chart for periods that have not yet been revisited since their inception.
- Keep Last (Per Period): Sets the maximum number of historical untested lines to display, allowing you to manage chart clutter.
Interactions
- Signal Period: Selects the primary timeframe for which interaction labels and statistics are calculated.
- Acceptance Buffer (ATR): Defines how much price must clear a level to be considered a confirmed breakout, using the Average True Range to adapt to volatility.
- Follow-Through (ATR): Determines the distance price must travel after an interaction to consider that interaction successful, filtering out false signals.
Dashboard and Style
- Show Dashboard: Toggles a summary table showing current prices, percentage change from the open, and the overall performance of interaction signals.
- Confluence Distance (ATR): The range within which multiple period labels will merge into a single, high-interest zone label.
Frequently Asked Questions
Free on Vela
Run it on Vela. Go further with a paid plan.
- Up to 500 strategy alerts, with webhook automation
- Up to 10× the chart history of Free
- Orderflow lookback up to full history
- Up to 100,000 monthly credits for Quant to customize it
- Futures data alongside crypto, stocks, forex and commodities

Run it on Vela. Make it yours with Quant.
Open this indicator free on Vela, our next-generation charting platform. Then ask Quant, our coding agent built into Vela, to retune it or turn it into a backtested strategy of your own.