Breakout Detector (Previous MTF High Low Levels)
 By LuxAlgoNov 16, 2023
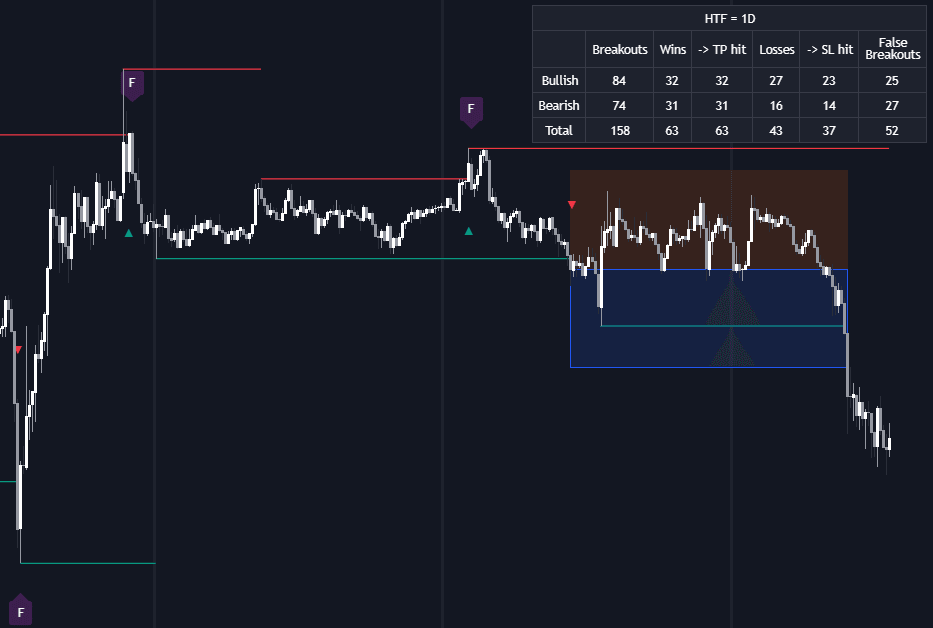
The Breakout Detector (Previous MTF High Low Levels) is an innovative trading indicator ideal for traders seeking to highlight breakouts of prior high and low levels from a higher timeframe. This indicator is designed to enhance trading strategies by providing traders with the ability to display take-profit (TP) and stop-loss (SL) levels based on a customizable Win/Loss ratio, detect false breakouts, and offer a comprehensive dashboard with various insightful statistics.
As a crucial note, keep in mind that previous high/low levels are subject to backpainting, which means they are drawn retroactively in their corresponding location. However, all other elements of the script are not impacted by backpainting, making this tool reliable for more accurate trading signals.
How to Trade with the Breakout Detector Indicator?
The magic happens when the price closes above or below a previous Higher Timeframe (HTF) high or low, respectively. In such events, the closing price serves as an entry point where Take Profit (TP) and Stop Loss (SL) levels are strategically placed. Once a TP or SL level is hit, the bordering of the SL/TP box is accentuated to highlight the outcome.
If there’s an opposite direction breakout occurring against an active one, the previous breakout levels cease updating. Missing either SL/TP level results in a partial loss or win, depicted by a highlighted box with a default dotted border, which can be customized to dashed or solid if preferred.
The Default mode for detecting False Breakouts is a valuable asset in identifying false positives, indicative of any potential trend reversals.
Furthermore, the indicator provides visualization at the start of a new HTF interval with a thick vertical grey line and includes a comprehensive, easy-to-read dashboard to review breakout results, giving traders a robust decision-making tool on their trading platforms.
In the example above, active, open breakouts appear colored in green or red, making it visually effective.
By enabling the 'Cancel TP/SL at the end of HTF' setting, traders can cut off updates for previous TP/SL levels as a new HTF interval begins.
Breakout Detector Indicator Features
Core Principles
- Start with detecting previous high and low of the chosen higher timeframe as new periods commence. Notably, breakout detection does not occur on the bar marking new HTF beginning.
- Valid breakouts are confirmed when the close price infringes previous HTF high/low levels.
- Same direction breakouts as active ones are ignored to maintain optimal trade focus.
- Opposite direction breakouts signal the halt of updates for prior breakout levels.
- Easily interpret highlighted visual elements for take profit and stop loss results.
Selecting Higher Timeframe Settings
Traders have the flexibility of two options for setting a higher timeframe:
• Choose a specific higher timeframe (e.g., Weekly TF on a 4h chart)
• Opt for a multiple of the current timeframe (example: 75 minutes TF on a 15-min chart - a 15 x 5 setup)
Bear in mind that using non-standard timeframes in multiples can lead to less desirable frequency changes.
Configuring Win/Loss Ratios
Within the Stop Loss (SL) / Take Profit (TP) settings, two key options prevail:
- W%:L%: Establish fixed percentages for TP and SL.
- W:L: Define loss (L) through Loss Settings, while win (W) is computed by multiplying L—for instance, W:L = 2:1 where W will be double the size of L.
Exploring Loss Settings
The last drawn element to the right remains active, clearly presented in green or red.
The Loss portion options include:
- Multiplying Average True Range (ATR) of the most recent 200 bars.
- Multiplying the Range Cumulative Mean (RCM).
- Using the Latest Swing with customized Length settings.
The Range Cumulative Mean divides the sum of Candle Range (high - low) by its bar index, offering a strategic advantage in setting loss.
Identifying False Breakouts
A False Breakout is marked when the price post-breakout returns above or below the defined breakout level.
Utilizing the Dashboard
Leverage Alerts for Effective Trading
This powerful tool provides traders with the following real-time alerts:
- Bullish/Bearish Breakout: Indicates new breakout developments.
- Bullish/Bearish False Breakout: Alerts one bar post-breakout when false breakout conditions meet.
- Bullish/Bearish TP: Signals when profit levels achieve success.
- Bullish/Bearish Fail: Warns when SL/stop-loss levels are triggered.
A new breakout that nullifies a prior one results in alert provision solely for the fresh event.
Configurations and Customizing Options
Tailoring Higher Timeframe Settings
- Option: Select HTF or Mult options based on preferences.
- HTF: Set higher timeframe beyond the current setting if HTF is preferred.
- Mult: Configure a multiple of the existing timeframe (e.g., setting 3 results in a 45-minute timeframe on a 15-minute base chart).
Configuring Win/Loss Levels
- SL/TP: Choose W:L or W%:L% to adjust the Win/Loss Ratio for Take Profit and Stop Loss settings. • W : L: Define the Ratio of Winning (TP) against Losing (SL) points; level L is detailed in Loss Settings. • W% : L%: Implements fixed breakout percentage as SL and TP.
Exploring Loss Settings
Opting for W : L as SL/TP demands defining the Loss section:
- Base Options: • RCM: Lean on Range Cumulative Mean • ATR: Utilize Average True Range of last 200 bars • Last Swing: Specify Last Swing Low for bull trends, Swing High for bear trends
- Multiple: Choose multiplication factors for RCM/ATR
- Swing Length: Determine the left period (right period defaults to 1)
- Colors: Personalize TP/SL box and border colors
- Borders: Customize border styling when breakout levels cease but TP/SL remains untouched. Options include dotted (dot, default), dashed (dsh), or solid (sol).
Additional Configurations
- Show Timeframe Change: Highlights a grey vertical line on the chart when a new HTF interval starts.
- Detect False Outbreak: Enable field for false breakout detection.
- Cancel TP/SL at the end of HTF: Restrict TP/SL updates commencing a new HTF interval.
Displaying the Dashboard
- Location: Select preferred dashboard placement (Top Right, Bottom Right, or Left)
- Size: Adjust text size from options such as Tiny, Small, or Normal.
FAQ
How do I access the Breakout Detector Indicator?
You can get access on the LuxAlgo Library for charting platforms like TradingView, MetaTrader (MT4/MT5), and NinjaTrader for free.
What are False breakouts, and how can they affect my trading strategy with this indicator? False breakouts occur when the price moves back below/above the breakout level almost immediately after the breakout, signalling potential trend reversals if not managed properly.
Can the Stop Loss and Take Profit Styling be customized? Yes, both the SL and TP can include custom settings for colors and border styles to suit individual preferences and strategies.
Free indicator
Get free access to this indicator on the platforms below.

The Library is free. Quant makes it yours.
Pull any concept or indicator into Quant: rebuild it, retune it, or turn it into a backtested strategy of your own.