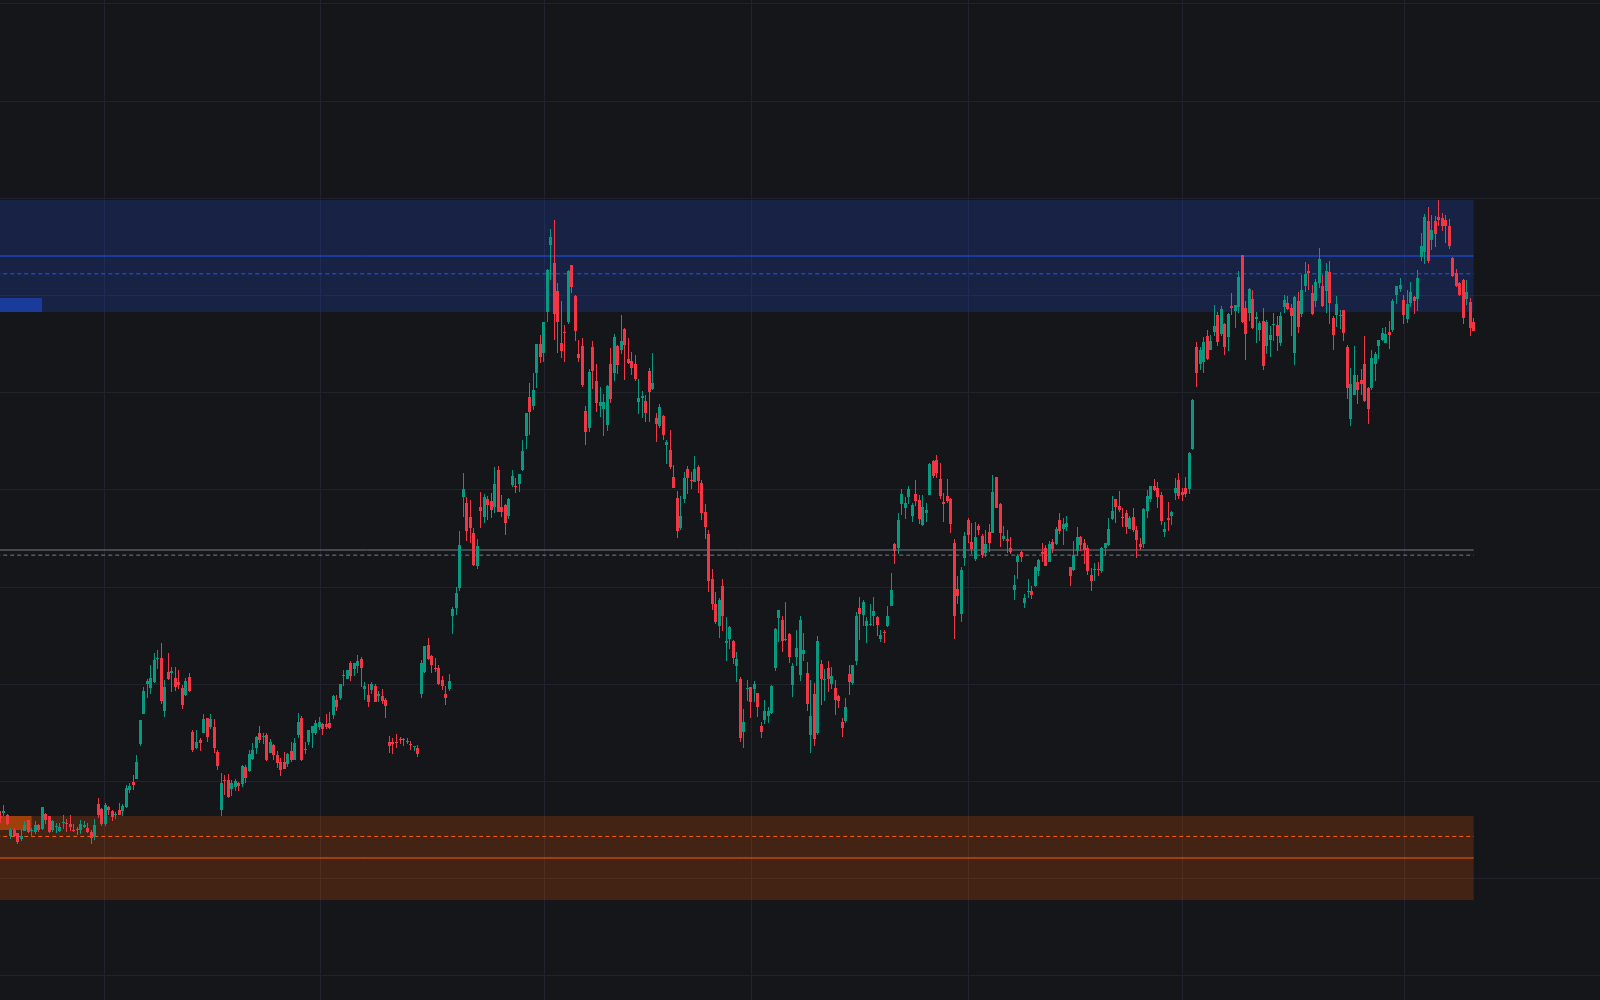
Rally Base Drop Signals
By LuxAlgoSep 10, 2025

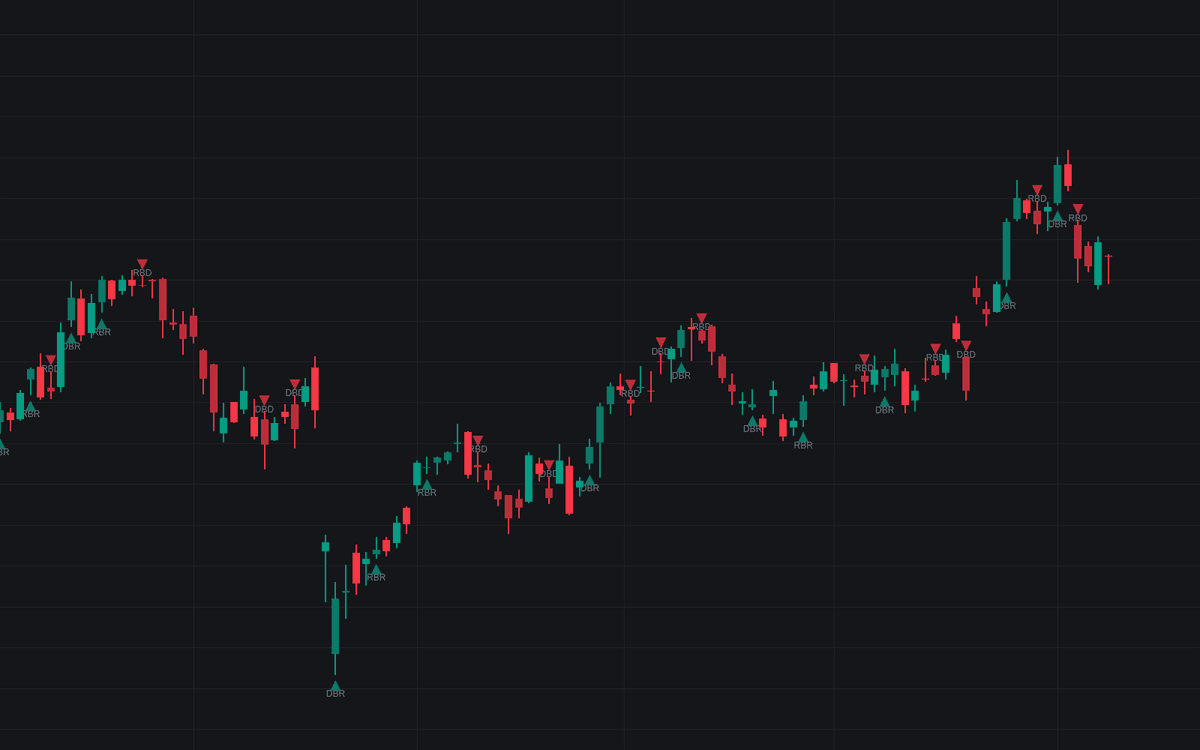
The Rally Base Drop trading indicator is a visual price action tool based on the widely-used Supply and Demand (SND) methodology. It focuses on identifying "Rally, Base & Drop" candle formations to help traders pinpoint areas of structure, key market turning points, and zones of potential price continuation or reversal. By labeling bars as “Rally,” “Base,” or “Drop” and identifying popular sequences like Rally-Base-Drop (RBD) and Drop-Base-Rally (DBR), this indicator offers a clear framework for mapping institutional order flow and planning trade entries with confidence.
How to Trade the Rally Base Drop Trading Indicator?
The Rally Base Drop trading strategy is an intuitive way to analyze price action and supply/demand imbalances. By categorizing candles into three main types, the indicator offers traders a practical edge in reading market structure and momentum.
- Rally: Defined by two or more consecutive bullish candles. These indicate strong buyer momentum and suggest potential demand areas.
- Drop: Defined by two or more consecutive bearish candles. These highlight strong selling pressure and point to possible supply zones.
- Base: A transitional candle, typically a single bullish or bearish candle that breaks the prior direction. Base candles represent a pause, consolidation, or transition in market sentiment.
This structured approach enables traders to anticipate potential reversals and continuation moves using candle sequences that align with institutional order block theory.
Rally & Drop Candle Patterns
Rally and Drop candles are the backbone of this indicator’s signal engine. They clearly define directional movement:
- Rally candles reflect zones where buyers dominate and are pushing price upward with strength.
- Drop candles signal strong seller interest and market weakness.
These candles often precede areas of institutional activity, and their identification is critical for any price action trading strategy.
Base Candle Logic
In supply and demand trading, the "Base" candle plays a unique role. It signals a brief equilibrium between buyers and sellers, often leading to a shift in trend or a continuation depending on the surrounding structure.
This indicator defines a base candle as one that either:
- Disrupts the existing momentum (bullish after bearish, or vice versa)
- Occurs between a Rally and a Drop (or vice versa)
Clusters of base candles may suggest indecision, ranging behavior, or a buildup of pending orders. In trading strategy terms, these are ideal areas to watch for breakouts or reversals.
Key Trading Sequences
Reversal Patterns: RBD & DBR
- Rally-Base-Drop (RBD): Marks a shift from bullish to bearish. It signals a fresh supply zone.
- Drop-Base-Rally (DBR): Marks a shift from bearish to bullish. It signals a fresh demand zone.
These reversal patterns are vital in SND-based trading strategies. They help identify where price is likely to react when it returns to those zones—enabling precise entries and stop-loss placements.
Continuation Patterns: RBR & DBD
- Rally-Base-Rally (RBR): A bullish continuation setup. Indicates sustained buying interest.
- Drop-Base-Drop (DBD): A bearish continuation setup. Signals persistent selling pressure.
Continuation sequences suggest a brief consolidation before the trend resumes. These are especially valuable for trend-following traders looking to scale into existing positions with low risk.
Indicator Features and Settings
Candle Coloring Modes
The Rally Base Drop indicator includes flexible candle coloring to match different trading needs:
A Rally or Drop requires at least two candles to confirm. Detection happens on the second candle, but the full sequence includes both.
You can choose between two primary bar color logic modes:
- Full Color Mode: Colors both candles once a sequence is detected. This offers a complete view of the pattern and is best for post-trade analysis or education.
- Color on Detection: Only colors the second (confirmation) candle. Ideal for real-time trading, as it avoids repainting the chart and keeps historical data unchanged.
Adjustable Settings
- Sequences: Toggle which sequences (RBD, DBR, RBR, DBD) are displayed.
- Bar Color Logic: Choose how candles are highlighted based on detection logic and trading preference.
This customization allows the indicator to adapt to both discretionary price action traders and systematic SND-based trading systems.
Frequently Asked Questions (FAQ)
What is the Rally Base Drop indicator used for in trading?
It helps traders identify supply and demand zones, turning points, and continuation areas using candlestick sequences derived from price action theory.
How do I use Rally, Base, and Drop patterns in my trading strategy?
You can look for reversal patterns (RBD/DBR) to catch new trend directions or continuation patterns (RBR/DBD) to ride existing trends. These setups can be combined with support/resistance or volume tools for confirmation.
Does this indicator repaint past bars?
No. While Rally/Drop detection occurs on the second candle, the indicator includes a “Color on Detection” mode to prevent repainting, which is optimal for live charts.
Can this be used with other indicators or systems?
Yes. This indicator complements trend-following systems, order block detection, SMC strategies, and other price action models.
How can I get access to the Rally Base Drop indicator?
You can get access on the LuxAlgo Library for charting platforms like TradingView, MetaTrader (MT4/MT5), and NinjaTrader for free.
Free indicator
Get free access to this indicator on the platforms below.
Unlock the entire LuxAlgo Library
Every indicator, every strategy, full charts, and complete access to Quant — our AI agent.