Supply and Demand Anchored
 By LuxAlgoSep 7, 2023
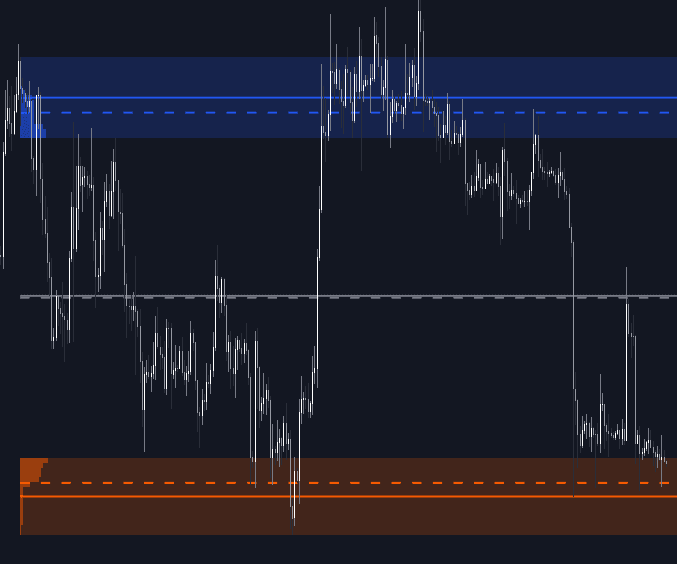
Supply and Demand Anchored puts zone analysis exactly where you want it. Set a start point and an end point directly on the chart, and the tool estimates supply and demand zones from the volume traded inside that window alone, the same method as its visible-range sibling, aimed at a market segment of your choosing. The finished zones extend across the chart as candidate support and resistance, and both anchors remain live: drag either one and everything recalculates on the spot. It slots naturally into LuxAlgo's levels lineup whenever a specific swing, session, or event deserves its own dedicated zone map.
How to Trade the Supply and Demand Anchored?
- Anchor the leg that matters: place the start and end points around the swing, range, or event you want profiled, rather than letting the chart view decide for you.
- Supply zones as resistance: price returning to the upper area meets a region flagged for concentrated selling interest, a spot to watch for stalls or turns.
- Demand zones as support: the lower area marks estimated buying interest, a candidate for bounces on a retest.
- Reframe by dragging: as conditions change, move an anchor to a new bar and read the fresh zones immediately.
The calculation is tied to your chosen points rather than the current view, so the zones describe a deliberate slice of history.
Supply and Demand Anchored Settings
- Threshold %: the share of the range's total volume required to establish each supply and demand area; raising it produces broader areas.
- Resolution: how many bins the range is divided into when locating each area. Higher values sharpen the boundaries.
- Intra-bar TF: the timeframe used to collect intra-bar data for the calculation.
Frequently Asked Questions
Free indicator
Get free access to this indicator on the platforms below.

The Library is free. Quant makes it yours.
Pull any concept or indicator into Quant: rebuild it, retune it, or turn it into a backtested strategy of your own.