Curve Position
 By LuxAlgoMay 11, 2026
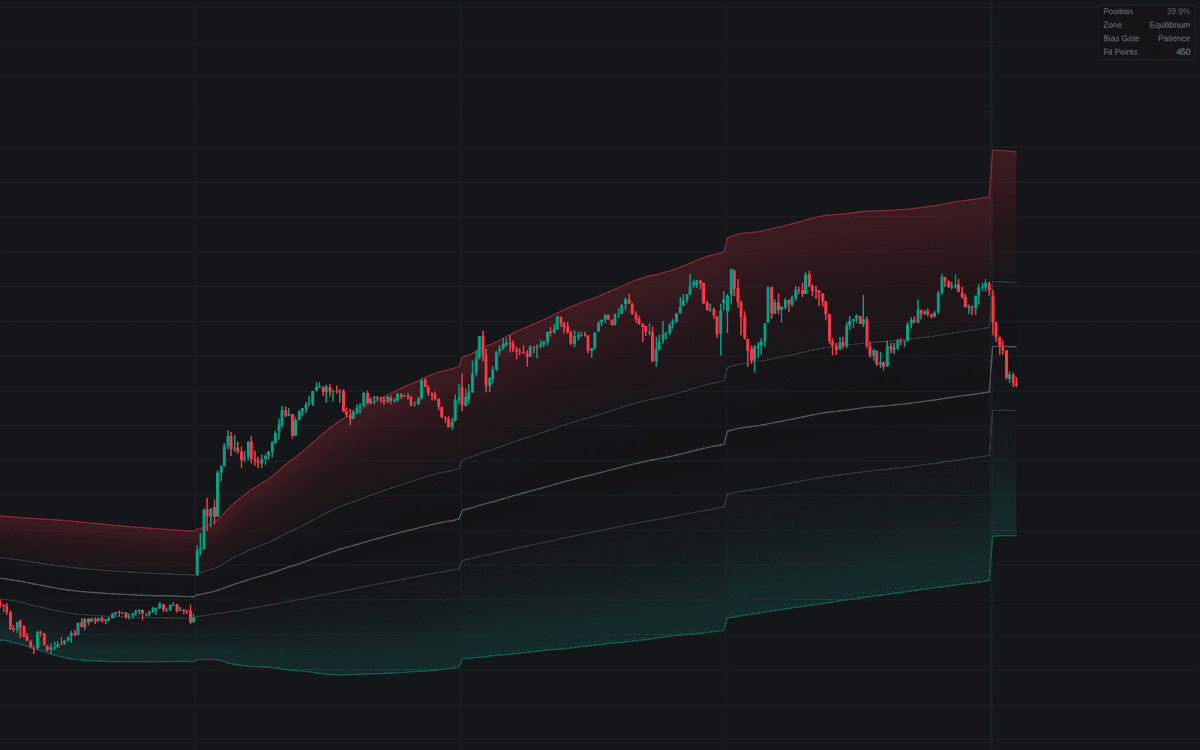

Curve Position turns the curve position question (where does price sit in the bigger picture?) into a measured readout. It fits a logarithmic growth regression (log price against log elapsed time) over the chart's entire history, wraps it in deviation bands 2 standard errors wide, and reads position 0-100% across the corridor. The fit is walk-forward (each bar uses the regression as of that bar), so plotted history does not repaint.
How to Trade the Curve Position?
- Low on curve (below 33.33%): longs have location and can aim across the corridor, the wholesale side of the map.
- High on curve (above 66.67%): shorts have location, but strong trends can pin the upper band, so gate any fade with a trend filter.
- Equilibrium: neither side holds a location edge; the framework's answer here is patience.
- Corridor break: readings beyond 0-100% mean a band itself gave way. Reassess the map as the fit re-anchors.
The dashboard reports position, zone, bias gate and the fit's point count; long daily or weekly histories make the location worth inheriting on execution timeframes.
Curve Position Settings
- Source (default close): series fitted; only positive values enter the log fit.
- Band Width (Std. Errors) (default 2.0): corridor half-width in log space, so the bands stay proportional to price.
- Warm-Up Bars (default 100): fitted points required before the curve, bands and readout display.
- Low On Curve Below (%) (default 33.33) and High On Curve Above (%) (default 66.67): the zone boundaries.
- Show Zone Boundaries (default on): draws the two separating levels on the price panel.
- Show Dashboard (default on), with location and size options.
- Style inputs cover the side colors, corridor gradient fills and optional zone transition markers.
Frequently Asked Questions

Original indicatorBuilt in-house by LuxAlgo
The Library is free. Quant makes it yours.
Pull any concept or indicator into Quant: rebuild it, retune it, or turn it into a backtested strategy of your own.