Structure & Trend Dashboard
 By LuxAlgoJul 28, 2026
Structure & Trend Dashboard is an indicator on Vela, our next-generation charting platform, written in Pine Script®.
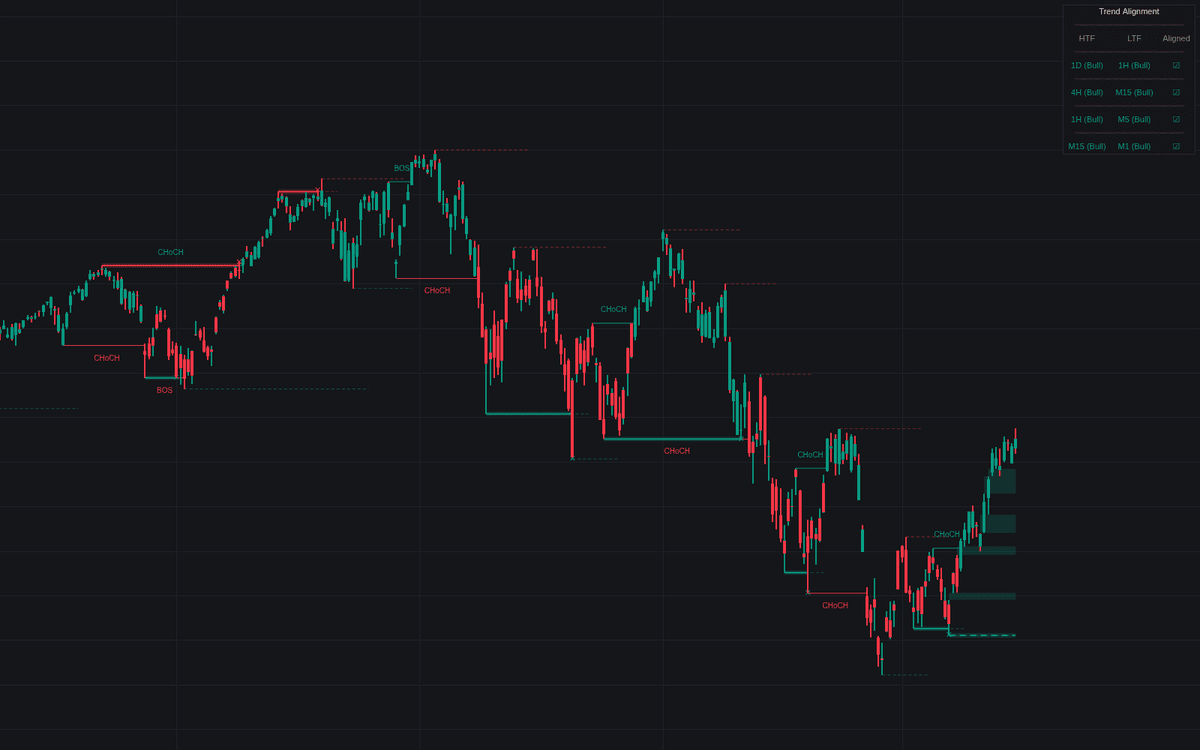

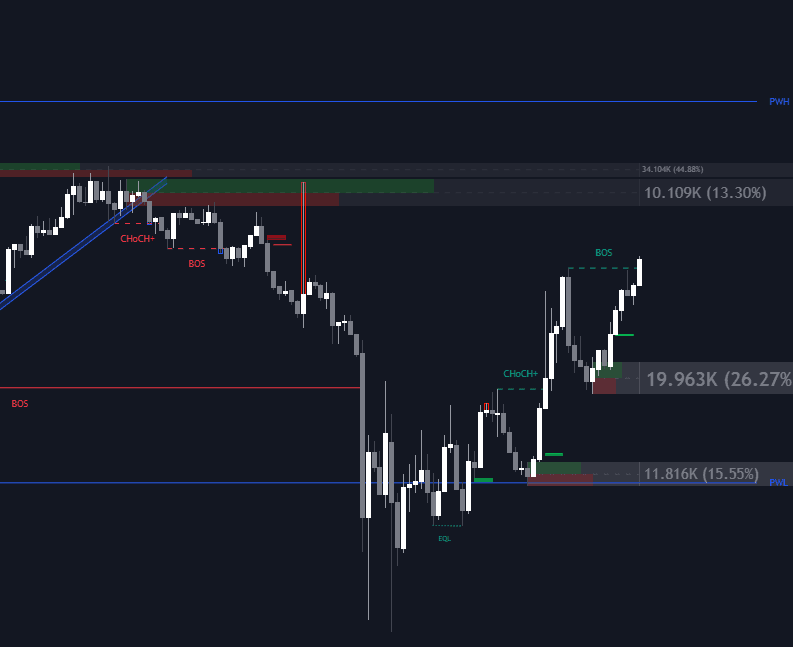
The Structure & Trend Dashboard condenses a multi-timeframe workflow into a single overlay. It reads swing structure from pivot highs and lows to classify each timeframe as bullish or bearish, marks every break of structure and change of character on the chart, highlights liquidity sweeps where stops were run, and detects fair value gaps, then summarizes trend agreement across pairs like 1D/1H or 4H/M15 in a color-coded dashboard.
How to Trade the Structure & Trend Dashboard?
- Checked box in the table: the higher- and lower-timeframe trends align, the confluence state many setups wait for.
- Unchecked box: the timeframes diverge; momentum is inconsistent and continuation is less dependable.
- BOS labels: structure broke with the trend at your chosen structure timeframe, while CHoCH labels warn the character of the move has changed.
- Sweep highlights: price exceeded a prior high or low to capture stops before reversing. Context for fade or continuation decisions.
- FVG boxes: imbalances that often act as magnets for future price movement; cap the active count to keep the chart readable.
Structure & Trend Dashboard Settings
- Show Market Structure / Structure Timeframe / Swing Length: structure labels, the interval they are computed on, and the pivot lookback (higher filters minor noise).
- Color Candles Based on Trend: paints candles by the detected structural bias.
- Show Liquidity Sweeps / Liquidity Timeframe: sweep detection and the interval it watches.
- Show Fair Value Gaps / Max Active FVGs: FVG display and the on-chart cap.
- Enable Dashboard / Position / Size: the alignment table and its placement.
Frequently Asked Questions
Free to use
Run it on Vela. Go further with a paid plan.
- Up to 500 strategy alerts, with webhook automation
- Up to 10× the chart history of Free
- Orderflow lookback up to full history
- More Quant usage to customize it, plus extra usage when you need it
- Futures data alongside crypto, stocks, forex and commodities
Also works on

Related indicators
All 17 Swing Structure Grammar indicators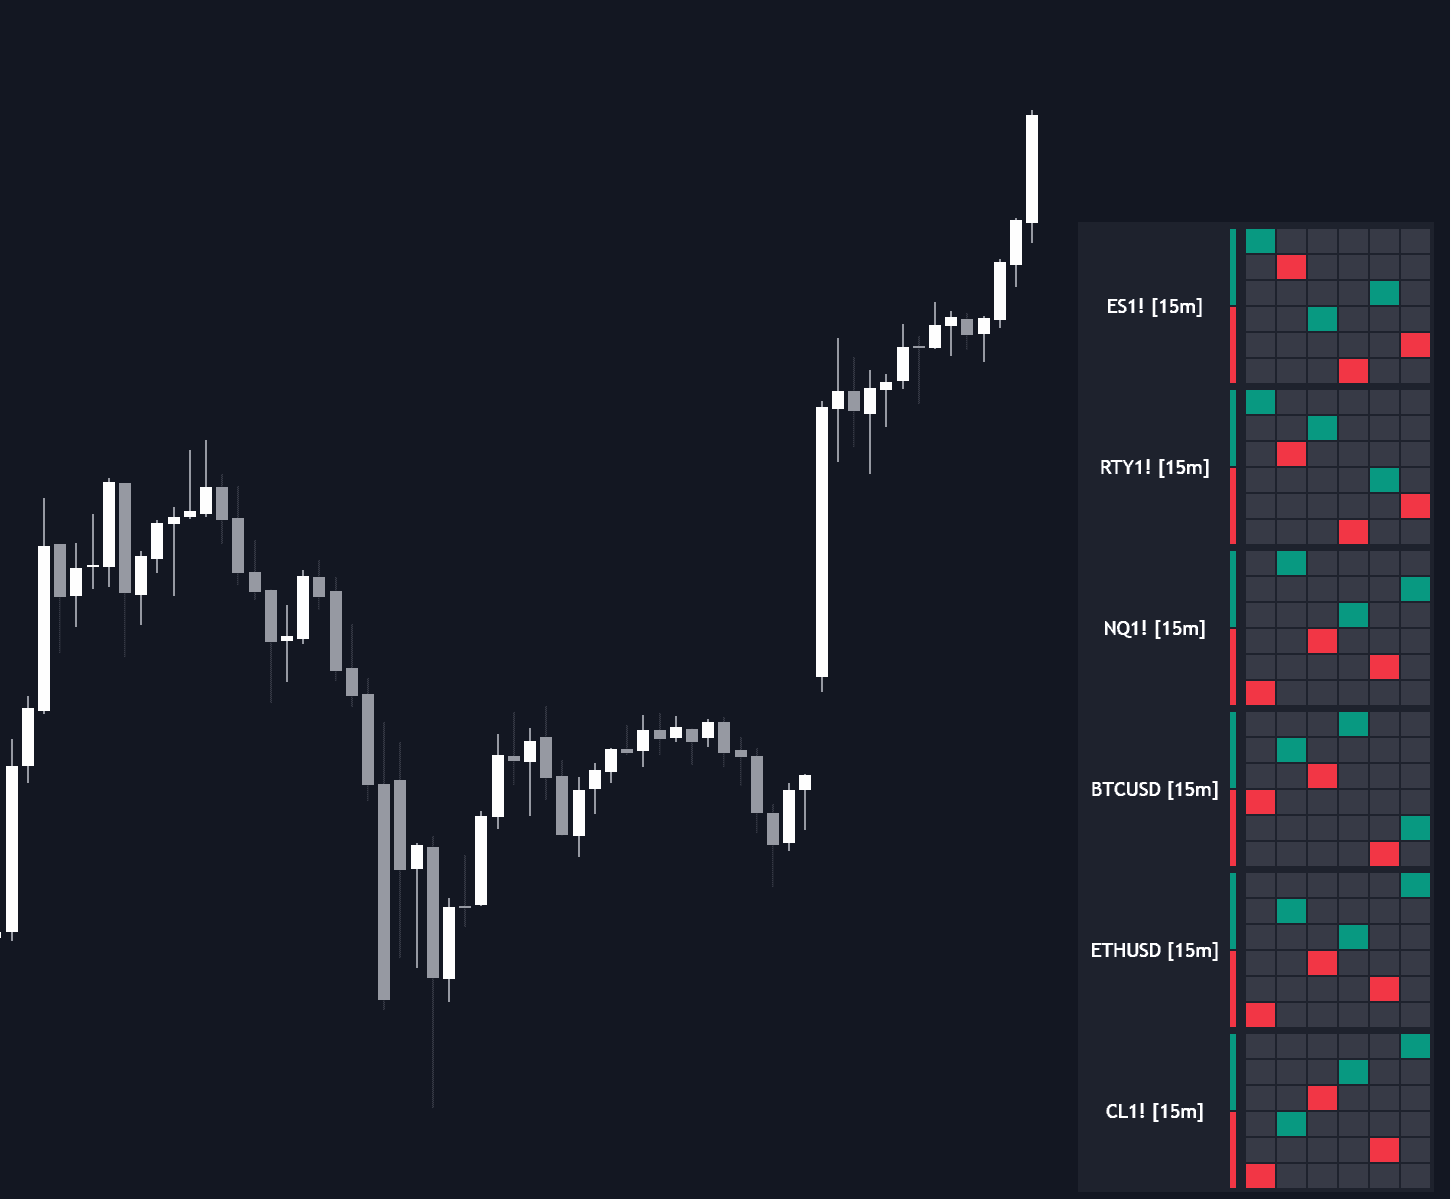
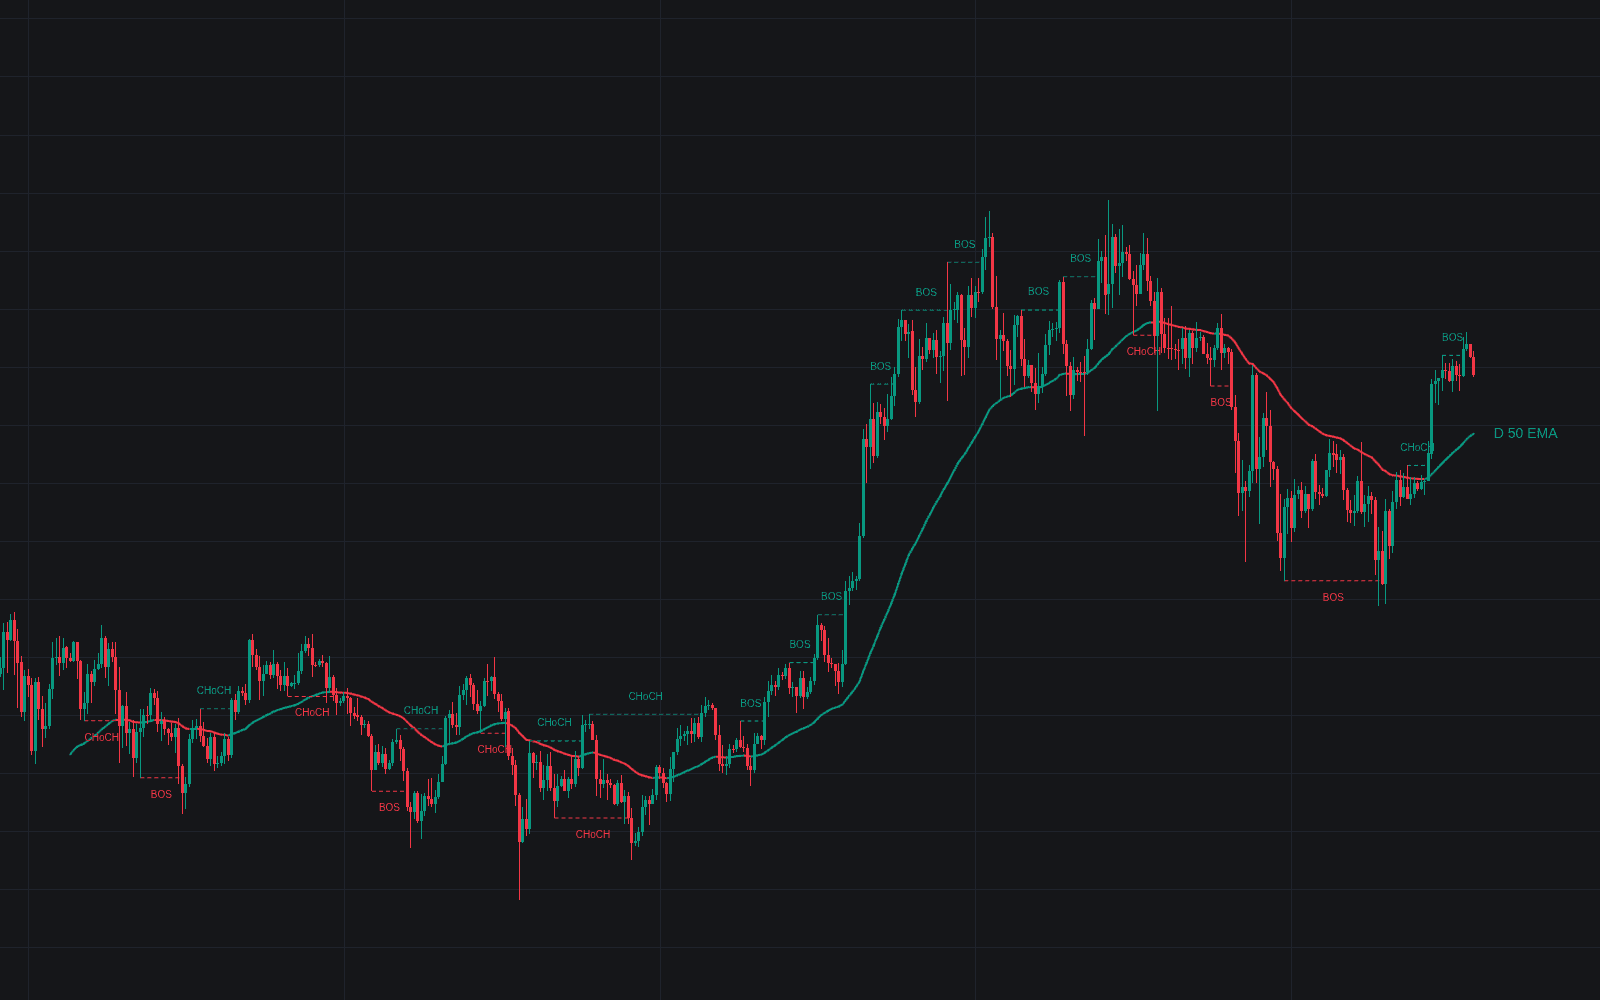
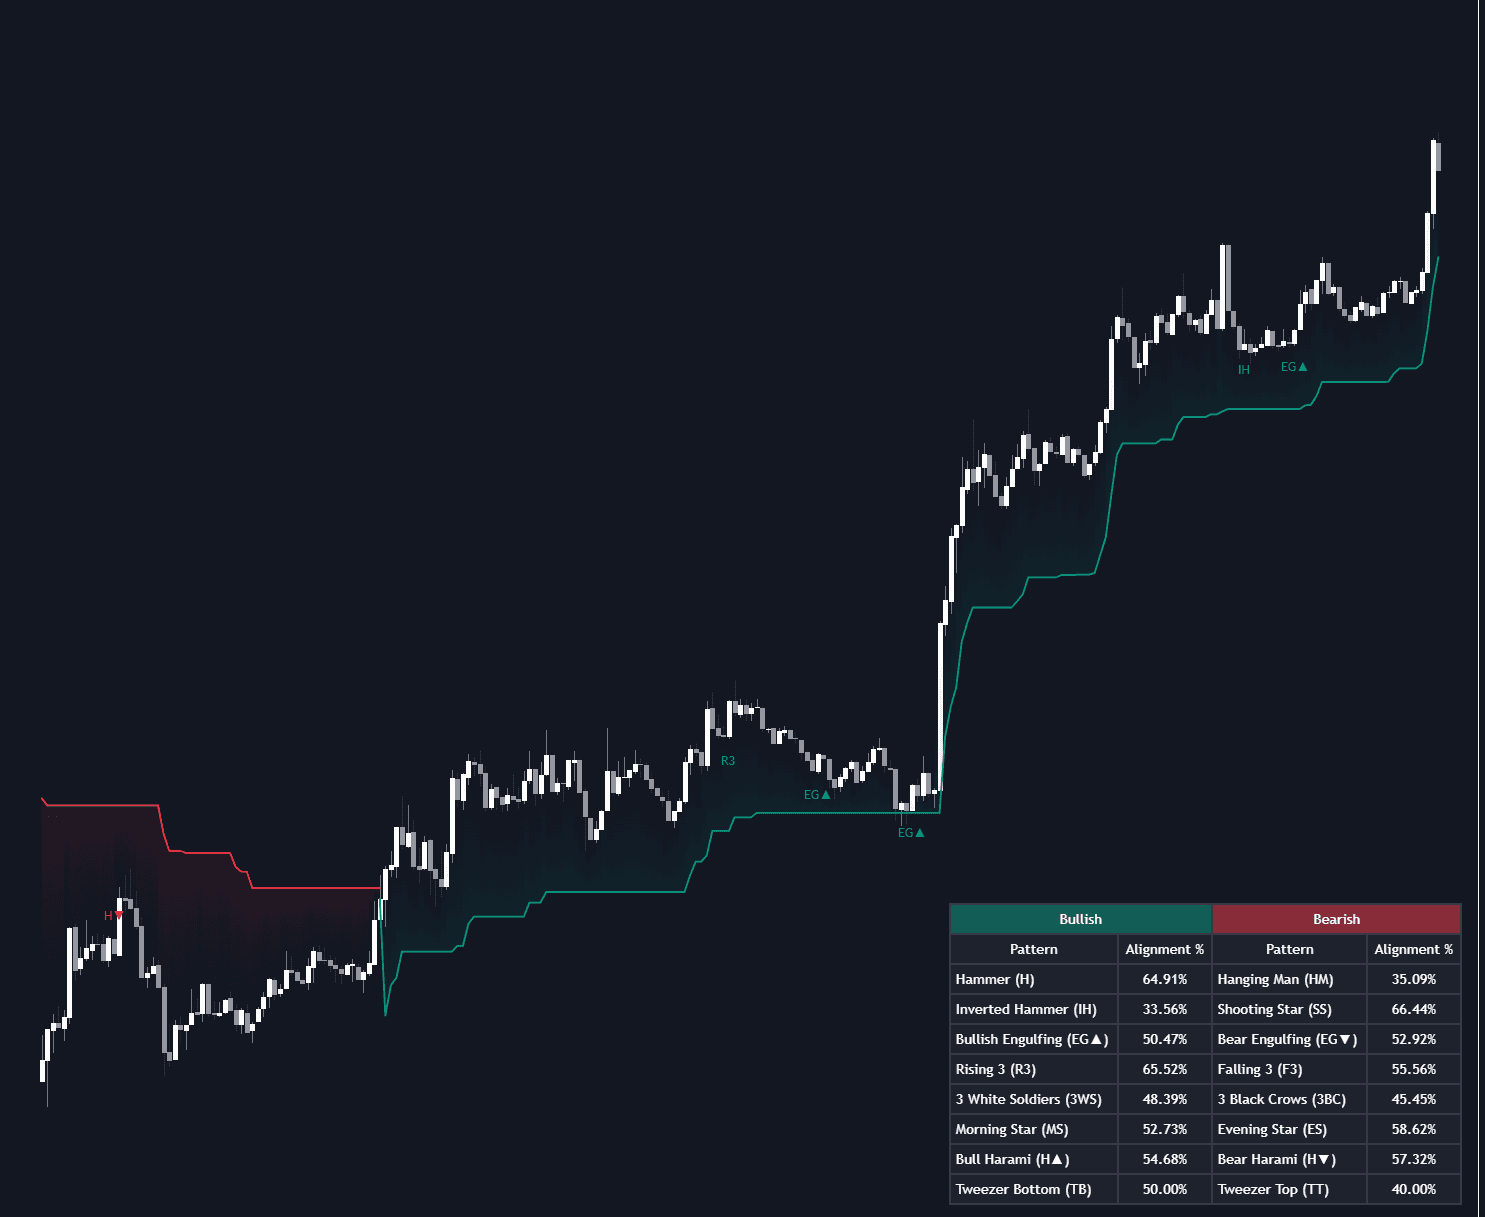
Run it on Vela. Make it yours with Quant.
Open this indicator free on Vela, our next-generation charting platform. Then ask Quant, our coding agent built into Vela, to retune it or turn it into a backtested strategy of your own.