ultrapremiumultimate
LuxAlgo - Screener (PAC)
 By LuxAlgoFeb 20, 2024
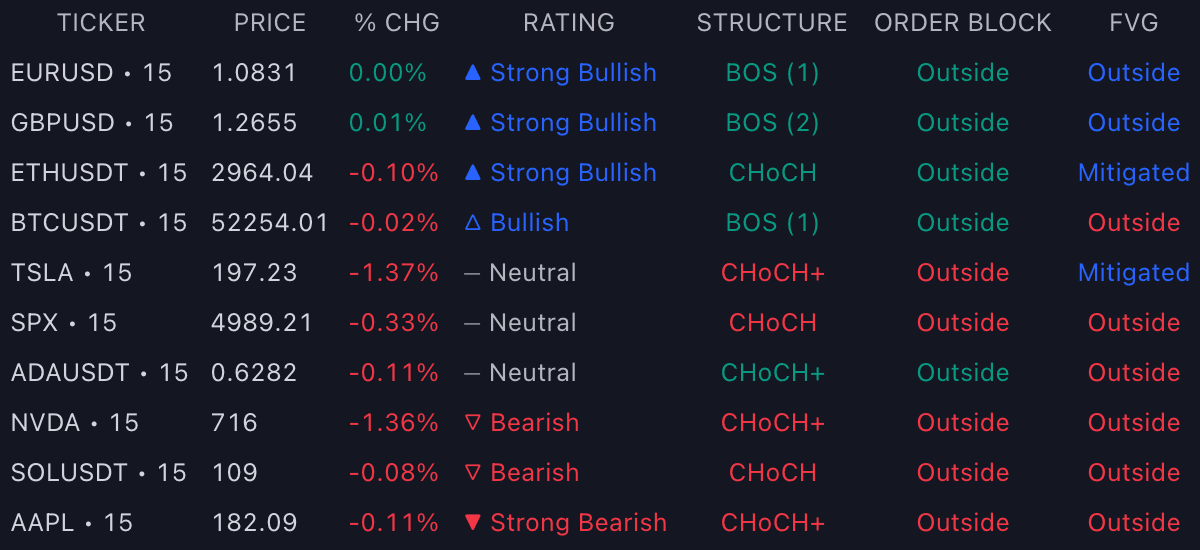
The LuxAlgo® - Screener (PAC) streams readings from the Price Action Concepts™ toolkit for a full watchlist into a single table: up to 10 tickers, each with its own timeframe, so structural setups surface without paging through charts. It serves price action and Smart Money Concepts traders who want to know which market just shifted structure or is sitting inside a point of interest. Access is bundled: having the toolkit automatically grants the PAC screener.
What's Inside the Screener (PAC)?
- Market columns: Price, Volume, %Change, and Change anchor each row before the price action data begins.
- Structure: the most recent market structure returned on the ticker, the CHoCH/BOS state that defines its trend context.
- Order Block columns: price position relative to the most recent Order Block area, plus Buy OB Volume, Sell OB Volume, and total OB Volume for that block, exposing how significant and how one-sided the zone is.
- Imbalances: the status of the most recent detected imbalance for a user-selected type (FVG, Inverse FVG, Double FVG, Volume Imbalance, or Opening Gap), bringing fair value gap monitoring to the whole list.
- P&D Zones: price position relative to the current premium, equilibrium, or discount zone on the ticker.
- Liquidity Grabs and EQHL: the most recent detected liquidity grab and the most recent equal high/low, flagging where stop-hunts and resting liquidity events just occurred.
- Rating: a five-grade confluence score computed from the enabled elements per ticker: ▲ Strong Bullish (over 80% of returned information bullish), △ Bullish (60–80%), ― Neutral (40–60%), ▽ Bearish (20–40%), ▼ Strong Bearish (under 20%).
- Filtering: each element has a filter dropdown; option-based elements select a precise state while numeric elements use Above/Below operators, and multiple conditions combine into one custom screen.
- Sorting: ascending or descending by Rating, Structure, Structure (Absolute), OB Volume, OB Buy Volume, or OB Sell Volume, with None keeping the configured ticker order.
- Placement: its own pane by default with six positions (Top/Bottom Center, Right, Left), or drag-and-drop straight onto the price chart.
How to Trade with the Screener (PAC)?
- Rank by structural strength: Structure sorting orders rows from the strongest bearish to the strongest bullish structures using the documented ranking (higher consecutive BOS, then CHoCH+, then CHoCH), while Structure (Absolute) ignores direction to surface the most decisive structures of either side.
- Hunt points of interest: filter for tickers where price sits inside or near the most recent order block and read the OB volume columns to judge which zones carry weight.
- Catch fresh imbalance plays: set the imbalance type to the gap variant you trade and watch the status column for newly formed or newly mitigated areas across the list.
- Locate events in premium or discount: a bullish structure event on a ticker also sitting in its discount zone is a higher-quality candidate than the same event at a premium.
- Confirm and execute on the chart: the screener shortlists; the toolkit's full display on the selected symbol provides the entry, with per-ticker timeframes letting you pre-align the structural picture across resolutions.
Key Settings & Modes
- Tickers: 10 slots with individual timeframes; defaults cover BTCUSDT, ETHUSDT, SOLUSDT, ADAUSDT, SPX, AAPL, TSLA, NVDA, EURUSD, and GBPUSD. Duplicated ticker/timeframe pairs do not display.
- Screener Elements: per-element enable toggles, colors, and filter dropdowns.
- Indicator Settings: Market Structure Length, Order Block Length, Imbalance Type, and EQHL Period control the underlying detections.
- Location: pane position, plus drag-and-drop onto the chart itself.
- Sorting: sorted element and direction.
Frequently Asked Questions
The Library is free. Quant makes it yours.
Pull any concept or indicator into Quant: rebuild it, retune it, or turn it into a backtested strategy of your own.