5 RSI Entry Strategies Using Support and Resistance
The Relative Strength Index (RSI) tells you how stretched recent momentum is; a support or resistance zone tells you where the market has turned before. Neither is an entry on its own, and the five strategies below are five different ways of requiring both to agree before a trade is taken. J. Welles Wilder introduced the RSI in 1978 as a bounded 0 to 100 oscillator built from the ratio of average gains to average losses over 14 periods, with 70 and 30 as the conventional overbought and oversold lines. Support and resistance are best treated as zones rather than single prices, because reversals scatter across wicks, bodies and closes. Here is the summary of the five approaches this article works through:
- RSI reversal at support: RSI below 30 while price sits in a tested support zone; the trigger is RSI crossing back above 30 with price holding the zone.
- RSI reversal at resistance: RSI above 70 while price sits in a tested resistance zone; the trigger is RSI crossing back below 70 with a rejection in price.
- RSI divergence at a level: price makes a new extreme into a zone while RSI does not; the divergence is the warning, the level supplies the location, and a price trigger completes the setup.
- RSI breakout confirmation: a full-bodied close through a zone with RSI on the same side of 50 and moving with the break, rather than fading it.
- RSI range trading: in a market that has been oscillating between two zones, buy the lower zone as RSI leaves oversold and sell the upper zone as RSI leaves overbought, until a decisive close ends the range.
Each approach suits a different regime, and each needs a stop beyond the far edge of the zone, a size derived from that stop and a target that has been tested rather than assumed. The LuxAlgo Relative Strength Index and the native Support and Resistance Levels with Breaks both open on Quant Charts in one click, and Quant, our coding agent, can turn any of the five rules into a strategy you can inspect in Code and test with Run.
Support and Resistance with RSI: Video Walkthrough
CodeTrading published this walkthrough in May 2023. It shows how support and resistance levels and RSI readings can be combined in a rules-based way; treat any performance shown as an illustration of the reading, not as evidence about results.
1. RSI Reversal at Support
The setup looks for two things at once: a support zone that has produced at least two separate reactions, and an RSI reading below 30 that says the decline into the zone has been one-sided. On their own, neither is a reason to buy. Oversold readings persist for weeks in downtrends, and support zones break. The combination narrows attention to declines that have reached a place where buyers have acted before and have exhausted their recent momentum doing so.
Entry Criteria
Define the zone first. Draw it from the extreme wick of the earlier reactions to the nearest cluster of candle bodies, so that it spans where reversals actually printed rather than one exact price; the Library's S/R zone page covers the convention. Then wait for RSI (14) to fall below 30 while price trades inside or just below the zone. The trigger is not the first touch. It is RSI crossing back above 30 on a closed bar while price is still holding the zone, the classic timing signal that says selling pressure has eased rather than merely paused.
Volume is a supporting read, not a rule. Falling volume on the approach followed by rising volume on the bounce is consistent with sellers tiring and buyers stepping in, but it is a tendency to check in your own data rather than a fact to rely on. If you use it, write it into the rule and test the rule with and without it.
Confirmation Signals
Two confirmations strengthen the case. A bullish divergence, where price prints a lower low into the zone while RSI prints a higher low, says the second push down carried less momentum than the first. A bullish reversal candle at the zone, such as a hammer or a bullish engulfing bar, shows the rejection in price itself. Wilder's own confirmation, the RSI failure swing, needs no price comparison: RSI dips below 30, rebounds to an interim peak, pulls back without a new low, then breaks that peak.
Risk Management Approach
The stop belongs beyond the far edge of the zone plus an allowance for ordinary wick traffic, not a fixed percentage below a single price. Size the position from that distance so the loss at the stop equals a fixed fraction of the account, and take the first target at the nearest resistance zone above. The hypothetical example below uses a $25,000 account and a 1% risk budget of $250; see Risking It Right for the budgeting logic.
| Step | Calculation | Result before costs |
|---|---|---|
| Support zone tested twice | Wick extreme $48.60 to body cluster $49.20 | Zone $48.60 to $49.20 |
| Trigger | RSI falls to 27, then closes back above 30 with the bar closing at $49.55 | Buy next open at $49.60 |
| Stop beyond the far edge | $48.60 minus a $0.30 allowance | Stop $48.30; $1.30 risk per share |
| Position size | $250 ÷ $1.30, rounded down | 192 shares; $249.60 planned risk; $9,523.20 notional |
| First target at the next resistance zone | $52.40 − $49.60 | $2.80 reward, about 2.15R |
| Gap through the stop, fill at $47.90 | 192 × ($49.60 − $47.90) | $326.40 loss, about 1.31R; a stop level is not a guaranteed fill |
Ideal Market Conditions
This is a range and pullback strategy. It works when the market is oscillating between zones or pulling back inside a larger uptrend; it fails when a downtrend is under way, because oversold readings then simply stay oversold and support zones give way one after another. The RSI range rules help here: in a bull regime RSI tends to bottom in the 40 to 50 band rather than reaching 30, so a dip below 30 in what looked like an uptrend is itself a warning that the regime may be changing. Daily and four-hour charts give zones enough history to be meaningful; on very short intervals a 14-period RSI reaches 30 constantly and the zones are too fresh to trust.
2. RSI Reversal at Resistance
The mirror image: a resistance zone with at least two prior rejections, an RSI reading above 70 on the approach, and a trigger when RSI crosses back below 70 while price fails to close beyond the zone. The same caution applies in reverse and with more force, because strong uptrends pin RSI above 70 for long stretches while price keeps rising. An overbought reading is context, not a sell signal; the resistance zone and the rejection in price are what make it tradable.
Entry Criteria
RSI above 70 while price is inside the resistance zone, then a closed bar with RSI back below 70 and price still inside or below the zone. A bar that closes decisively above the zone cancels the setup; that is a breakout, covered in strategy 4, not a reversal. Rising volume on a rejection wick is consistent with sellers meeting the rally, but as in strategy 1 it is a read to test rather than a rule to assume.
Confirmation Signals
Bearish divergence, a higher high in price against a lower high in RSI, says the second push up carried less momentum. A shooting star, bearish engulfing bar or doji at the zone shows hesitation in price. A close below the most recent minor swing low while RSI is falling from above 70 is the structural confirmation many traders wait for, at the cost of a later entry.
Risk Management Approach
Stop beyond the far edge of the resistance zone plus an allowance, size from the distance, and first target at the nearest support zone below. Shorting carries the extra risk that gaps against the position are unbounded, so the allowance and the position size should both reflect the instrument's overnight behavior. If the zone is the top of a range, the range midpoint is a reasonable place to take partial profit and the range bottom the final target.
3. RSI Divergence with Support and Resistance Levels
Divergence compares two series: price and momentum. Regular bullish divergence is a lower low in price against a higher low in RSI; regular bearish divergence is a higher high in price against a lower high in RSI. On its own a divergence says only that the latest extreme was made with less momentum than the one before. Trends routinely extend through several of them. Anchoring the divergence to a zone adds the missing piece, a location where the market has turned before, and reduces the number of divergences you act on to the ones that form where a reversal is plausible.
Entry Criteria
- Bullish: price makes a lower low into a support zone while RSI makes a higher low. The divergence is not the entry; the trigger is a price event, such as a bullish reversal bar closing back inside the zone, or a close above the minor swing high that separates the two lows.
- Bearish: price makes a higher high into a resistance zone while RSI makes a lower high. Enter on a rejection bar or a close below the minor swing low between the two highs.
A hidden divergence, the mirror case that forms inside a pullback, points to continuation rather than reversal. It belongs to a different rule and should not be mixed into this one.
Confirmation Signals
- A reversal candle at the zone, such as a hammer, engulfing bar or doji, shows the rejection in price rather than only in the oscillator.
- Agreement across timeframes, for example a divergence visible on both the four-hour and daily charts at the same zone, is a hypothesis about strength worth testing; it is not a guarantee.
- Elevated volume on the reversal bar is consistent with participation behind the turn. Test whether it adds anything to your rule before requiring it.
Risk Management Approach
- Stop beyond the price extreme that formed the divergence, plus an allowance, which is usually just beyond the far edge of the zone.
- First target at the next zone in the direction of the trade. Because divergences form at extremes, the first zone is often far enough away for a reward of two to three times the risk, but measure it rather than assume it.
- Keep the fraction of the account at risk fixed across trades so that a run of failed divergences, which will happen, costs a known amount.
4. RSI Breakout Confirmation at Key Levels
The first three strategies fade moves into zones. This one goes with a move through a zone, and uses RSI to check that momentum agrees with the break. The concern it addresses is the false breakout: price pokes through a level, finds the stops and breakout orders clustered beyond it, and closes back inside. Requiring a full-bodied close beyond the zone and an RSI reading on the same side of 50 as the break filters some of those.
Entry Criteria
For a long, a bar closes above the resistance zone, not merely through it on a wick, and RSI is above 50 and rising; a reading pushing through 60 or 70 on the breakout bar is normal strength in a breakout, not a reason to fade it. For a short, a close below the support zone with RSI below 50 and falling. RSI moving against the break, for example a close above resistance while RSI is falling from 75, is a divergence and belongs to strategy 3.
Confirmation Signals
Volume on the breakout bar is the most common confirmation, and the Library's volume at breakout page sets out the reasoning. A retest of the broken zone that holds, with RSI staying above 50 through the pullback, gives a second, later entry with a tighter stop. Agreement with a trend filter such as a rising moving average or a MACD above zero is a hypothesis to test; combined rules should be tested as one rule.
Risk Management Approach
Stop back inside the broken zone, typically beyond its near edge, so that a false breakout that closes back inside takes you out. Because breakout stops are usually wider than reversal stops on the same chart, the position is smaller for the same risk budget. Sizing from ATR keeps the stop distance proportional to current volatility. A trailing stop behind successive swing lows lets a genuine trend run; write the trailing rule down and test it, since a tight trail exits most breakouts on the first pullback.
Ideal Market Conditions
Breakout confirmation suits markets that are trending or emerging from a long consolidation. It performs poorly inside established ranges, where most breaks fail, which is exactly where strategies 1, 2 and 5 do their work. Deciding which regime you are in before choosing a strategy is the single most important step in this article.
5. RSI Range Trading Between Support and Resistance
When price has been oscillating between a support zone and a resistance zone for several swings, the market is in a trading range, and RSI's overbought and oversold readings mean what the textbook says they mean: the move to the boundary has stretched, and the boundary has held before. Range trading applies strategies 1 and 2 in alternation, with the added discipline of leaving when the range ends.
Entry Criteria
Buy when price is in the lower zone and RSI crosses back above 30 on a closed bar; sell or short when price is in the upper zone and RSI crosses back below 70. Wait for the cross rather than the first touch of the level, and skip trades where price has already travelled a large part of the range before the trigger arrives. Stricter thresholds such as 20 and 80 produce fewer, more stretched signals; whether they produce better results is a question for your test, not a rule.
The hypothetical example below uses a range between a $49.70 to $50.30 support zone and a $54.60 to $55.20 resistance zone, a $25,000 account and a 1% risk budget of $250.
| Step | Calculation | Result before costs |
|---|---|---|
| Trigger | RSI 26 in the lower zone, then a close back above 30 | Buy next open at $50.45 |
| Stop beyond the far edge | $49.70 minus a $0.30 allowance | Stop $49.40; $1.05 risk per share |
| Position size | $250 ÷ $1.05, rounded down | 238 shares; $249.90 planned risk; $12,007.10 notional |
| Partial profit at the range midpoint | Sell 119 shares at $52.45 | $238.00 banked, about 0.95R on the whole position |
| Final target just inside resistance | Sell 119 shares at $54.50 | $481.95 further; total about 2.88R |
| Range ends: close below $49.70 before the target | Exit at the next open, $49.55 | 238 × $0.90 = $214.20 loss, about 0.86R |
Confirmation Signals
A reversal candle at the boundary, an RSI failure swing, or a divergence between successive touches of the same zone all add evidence. The most useful confirmation, though, is negative: a full-bodied close beyond either zone means the range has ended, and the correct response is to stop range trading rather than to look for one more bounce.
Risk Management Approach
Stops sit beyond the far edge of the zone being traded plus an allowance scaled to the instrument's volatility, not a fixed cent amount. Partial profit at the midpoint and the balance near the opposite zone is a common structure; test it against holding the full position, since taking half early lowers both the average win and its variance. Range trades fail in clusters when a range breaks, so the fixed fraction at risk matters more here than the win rate of any single setup.
Strategy Comparison Table
| Strategy | Entry criteria | Confirmation | Stop and target | Regime |
|---|---|---|---|---|
| RSI reversal at support | RSI below 30 in a tested support zone, then a close back above 30 | Bullish divergence, failure swing, hammer or engulfing bar | Stop beyond the zone's far edge; target the next resistance zone | Ranges and pullbacks in uptrends |
| RSI reversal at resistance | RSI above 70 in a tested resistance zone, then a close back below 70 | Bearish divergence, shooting star or engulfing bar, minor swing low broken | Stop beyond the zone's far edge; target the next support zone | Ranges and pullbacks in downtrends |
| RSI divergence at a level | New price extreme into a zone that RSI does not confirm, plus a price trigger | Reversal candle, agreement across timeframes | Stop beyond the divergence extreme; target the next zone | Possible turning points; fails often in strong trends |
| RSI breakout confirmation | Full-bodied close through a zone with RSI on the same side of 50 and moving with the break | Breakout volume, holding retest | Stop back inside the zone; trail behind swings | Trends and range exits |
| RSI range trading | RSI leaving oversold at the lower zone or overbought at the upper zone | Reversal candle at the boundary; a close beyond either zone ends the range | Stop beyond the far edge; partial at the midpoint, balance near the opposite zone | Established ranges only |
Key Takeaways for Strategy Selection
- Regime first: reversal and range strategies need a market that respects its zones; breakout confirmation needs one that is leaving them. The RSI range rules, roughly 40 to 80 in uptrends and 20 to 60 in downtrends, are a quick regime check before any signal is taken.
- Win rate and reward are linked: no strategy has a fixed win rate. What can be stated is the break-even rate for a given reward: a rule that targets 2R breaks even, before costs, at a 33% win rate, a 3R rule at 25%, and a 1R rule at 50%. Your test tells you which side of the line a rule sits on. See Risk-Reward Ratio vs Win Rate.
- Stops come from the zone, size comes from the stop: wide zones mean smaller positions, not larger losses.
- Confirmations are hypotheses: volume, candles and multi-timeframe agreement each reduce trade count. Test the rule with and without each one on identical data before making it a requirement.
Using RSI and Support and Resistance on Quant Charts
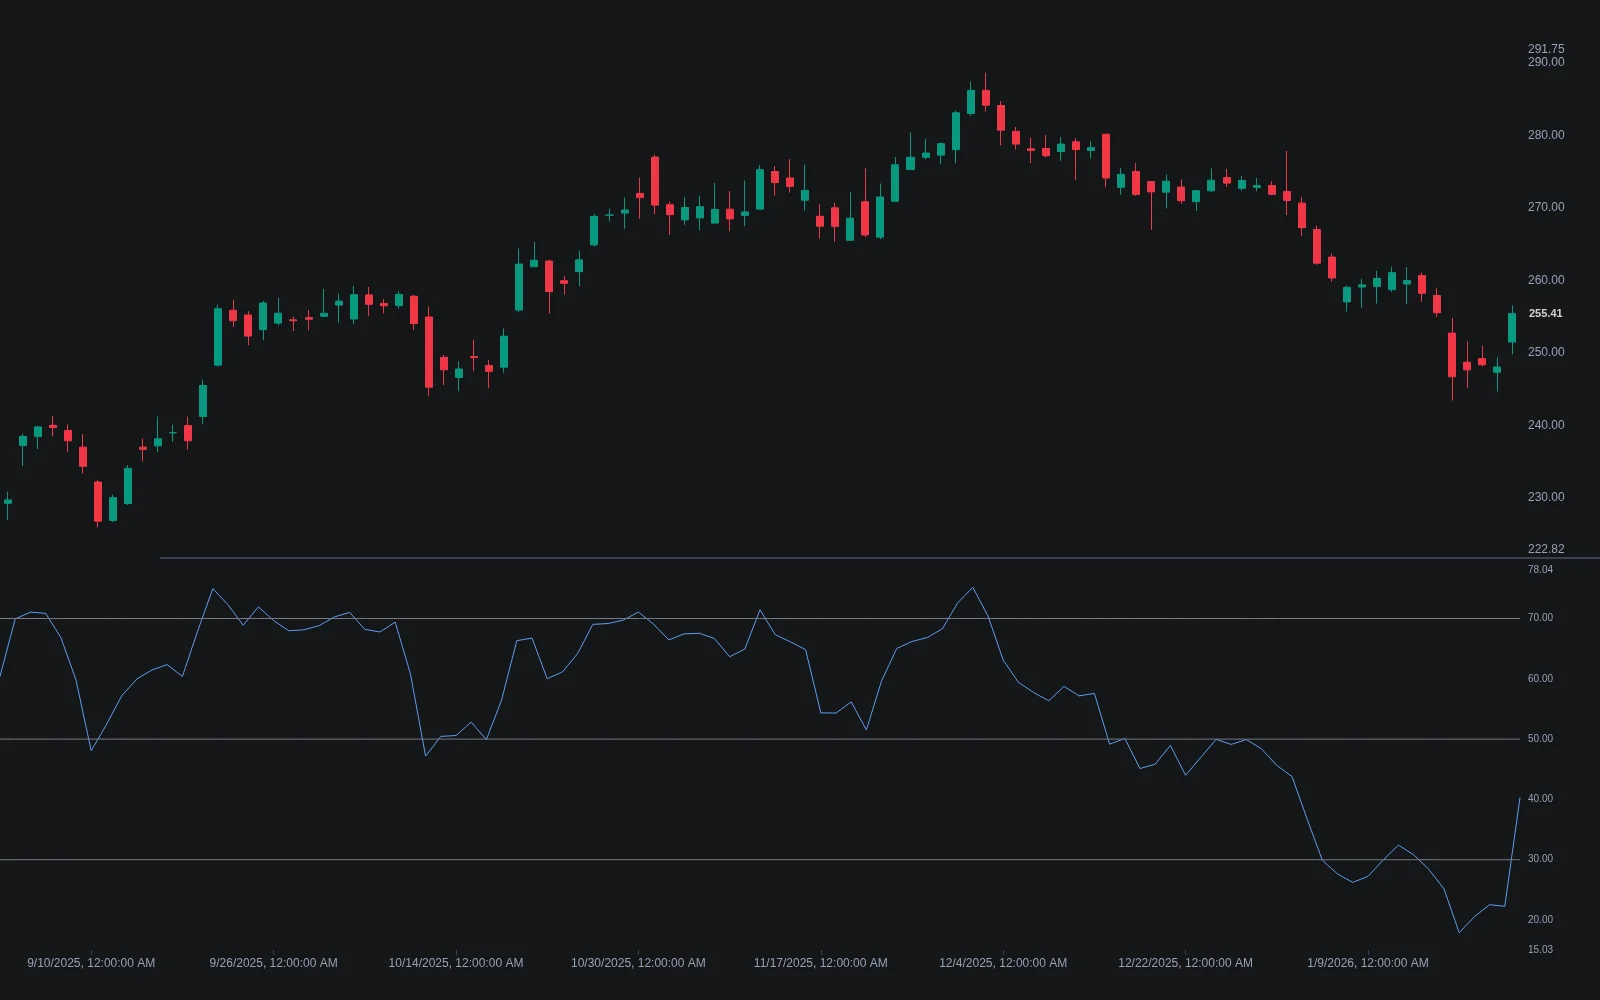
The Library's Relative Strength Index is Wilder's calculation with the classic inputs, Length 14, Source close, Overbought 70 and Oversold 30, and four alerts that match the triggers used above: Overbought and Oversold fire when RSI crosses into a level, Exit Overbought and Exit Oversold when it crosses back out. The exit alerts are the ones strategies 1, 2 and 5 use. Its source is published on the page.
| Tool | What it adds | Where it runs |
|---|---|---|
| Relative Strength Index | Wilder's RSI with 70/30 levels, 50 midline and cross-in / cross-out alerts | Quant Charts, from the Library page |
| Support and Resistance Levels with Breaks | Pivot-based levels from Left and Right Bars inputs; breaks tagged only when a volume oscillator clears a threshold, with bull and bear wick labels | Quant Charts, from the Library page |
| Support and Resistance Signals MTF | Zones from swing highs and lows on a chosen detection timeframe, with breakout, test, retest and rejection events; breakouts are non-repainting and carry the bar's volume | Quant Charts, from the Library page |
The two native support and resistance tools cover the level side. Support and Resistance Levels with Breaks is the leaner choice when volume-filtered breaks are all you need for strategy 4; Support and Resistance Signals MTF adds tests, retests and rejections, the events strategies 1, 2 and 5 wait for, and can detect its zones on a higher timeframe than the chart you trade. Other Library tools run their own calculations; none of them reads the RSI, and a signal from one near an RSI trigger is confluence to test rather than confirmation.
Testing the Rules with Quant
Pick one strategy and write it completely: the RSI length and levels, how the zone is defined (for example pivots with given Left and Right Bars, or a fixed price band), the trigger bar, the stop allowance, the target or trailing rule and the position sizing. Describe it to Quant, inspect the Code to confirm that every condition is evaluated on closed bars, and click Run. The Making Strategies with Quant guide shows the workflow, and the native backtest guide explains the Backtest Summary: net profit, trade count, win rate, maximum drawdown and profit factor, with commission and slippage set in the strategy properties.
Compare each strategy with its unfiltered version, for example RSI crosses without the zone requirement, and with a plain zone rule without RSI, on identical data and costs. Read trade count before return, and hold out a period the rule never saw.
Conclusion
RSI and support and resistance answer different questions, how stretched momentum is and where the market has turned before, and the five strategies are five ways of requiring both answers to line up. The reversal and range strategies fade moves into zones and depend on the market respecting them; breakout confirmation goes with moves through zones and depends on the market leaving them; divergence sits between the two as a warning that needs a location and a trigger. Choosing the regime first, taking the stop from the zone and the size from the stop, and treating every confirmation as a hypothesis to test are what turn the indicator readings into a rule.
The native RSI and support and resistance tools on Quant Charts give you the readings with alerts on the exact crosses these rules use, and Quant lets you test each rule, and each confirmation, before trading it.
FAQs
What market conditions suit RSI strategies with support and resistance?
Reversal and range strategies need a market that has been respecting its zones, typically a trading range or an orderly pullback within a trend. Breakout confirmation needs the opposite, a market leaving a consolidation. Reading the regime first, including the RSI range rules, matters more than any individual signal.
Does RSI above 70 mean I should sell?
No. Above 70 means recent gains dominate recent losses, which is exactly what strong uptrends produce, and RSI can hold above 70 while price keeps climbing. In these strategies an overbought reading only matters inside a tested resistance zone, with a cross back below 70 and a rejection in price as the trigger.
How does volume confirm RSI signals?
Volume is a read on participation: rising volume on a rejection at a zone, or on a breakout bar, is consistent with real interest behind the move. It is a tendency to test in your own data rather than a rule; add it to a strategy only if the test shows it improves results after costs.
How do reversal and breakout strategies differ in risk?
Reversal stops sit beyond the far edge of the zone being faded and are usually tighter, so positions are larger and failures are frequent but small. Breakout stops sit back inside the broken zone and are usually wider, so positions are smaller and the rule depends on a few trades that run. The fraction of the account at risk should be the same in both.
Which RSI length should I use?
Wilder's default of 14 is the standard and the one most other participants watch. Shorter lengths reach 30 and 70 constantly and suit fast mean-reversion rules; longer lengths reserve the extremes for unusual moves. Match the length to your holding period and test it; there is no universally better number.
Can I backtest these RSI strategies on Quant Charts?
Yes. Open the Relative Strength Index and a support and resistance tool from the Library with Open on Quant Charts, describe one complete rule to Quant including the zone definition, trigger, stop, target and sizing, inspect the Code and click Run. Compare it with the unfiltered rule under the same costs.
References
LuxAlgo Resources
- Quant Charts
- LuxAlgo Quant
- Relative Strength Index Indicator
- RSI Concept
- Support and Resistance Levels with Breaks
- Support and Resistance Signals MTF
- S/R Zone
- RSI Failure Swing
- RSI Range Rules
- Regular Bullish and Bearish Divergence
- Hidden Divergence
- False Breakout
- Volume at Breakout
- Retest
- Trading Range
- Hammer
- Bullish and Bearish Engulfing
- Shooting Star
- Doji
- ATR
- MACD
- Making Strategies with Quant
- Native Backtest Guide
- The Key to Understanding RSI
- Risk-Reward Ratio vs Win Rate
- Risking It Right
External Resources
Read next