Concept
Overbought/oversold
Overbought/oversold, also known as 80/20 & 70/30 conventions, is a Momentum & Oscillators concept. The Library holds 3 implementations, each one a working definition you can pull into Quant.
Top Overbought/oversold indicators
The top custom implementations, built on the original standard Overbought/oversold formula.
3 total
Want to trade Overbought/oversold? Any of the 3 implementations below is one prompt away from a backtested strategy in Quant.
.png&w=3840&q=75)
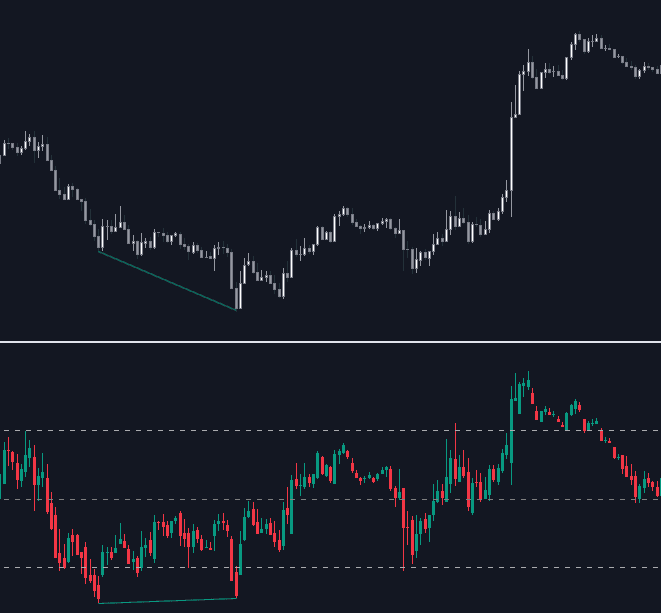
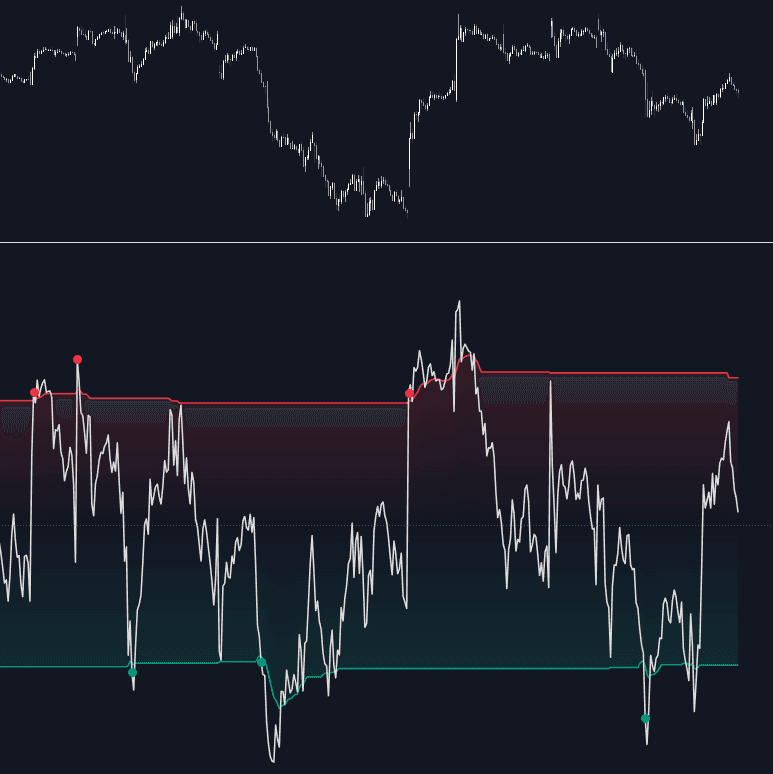
What is Overbought/oversold?
Overbought and oversold are zone labels on bounded oscillators. When a momentum gauge such as RSI rises above its upper threshold (70 in Wilder's convention) the market is called overbought; below the lower threshold (30) it is oversold. The Stochastic Oscillator uses 80/20, Williams %R uses -20/-80. The label means price is stretched relative to its own recent behavior, not that the instrument is expensive or cheap in any absolute sense.
What the label implies depends on regime. Inside a trading range, extreme readings often precede rotation back toward the middle. In a strong trend the same readings mark strength: a bounded oscillator can hold above 70 for weeks while price keeps climbing, a state traders call pinned or embedded. That is why the common trigger is not entry into the zone but the cross back out of it, and why some systems read the first push into overbought as initiative rather than exhaustion.
The convention matters because it is the shared grammar of nearly every oscillator. Thresholds decide when a divergence or failure swing counts, when a screener flags a symbol, and when a mean-reversion system arms. Misreading the regime, fading every overbought print inside a persistent trend, is the classic failure mode.
How to read overbought/oversold zones
The zones are conventions layered on a bounded scale, so reading them is mostly about context.
- 1Pick a bounded oscillator and note its conventional thresholds: 70/30 for RSI, 80/20 for stochastics, -20/-80 for Williams %R. Unbounded gauges like CCI use ±100 by convention instead.
- 2Classify the regime before reading the zone, using market structure or a higher-timeframe trend filter. In a range an extreme argues for reversion; in a trend it often argues for continuation.
- 3Treat entry into the zone as a condition, not a signal. The usual trigger is the cross back through the threshold, or corroborating evidence at the extreme such as divergence or a failure swing.
- 4Adjust thresholds to the instrument and regime. Persistent bull phases may never print RSI 30, which is why asymmetric schemes such as RSI range rules shift the operating bands instead of keeping 70/30 fixed.
How traders use it
- As mean-reversion arming inside ranges: wait for the oscillator to re-enter the normal zone and fade back toward the middle, often paired with an S/R zone or band tag at the range boundary.
- As a pullback timer inside trends: an oversold print in an uptrend flags a dip to consider buying rather than a top to sell, which keeps oscillator signals aligned with the prevailing direction.
- As a strength read: some momentum systems deliberately buy the push into overbought, treating it as a momentum thrust that marks initiative, and only exit once the reading drops back out.
- As screening grammar: scanning a universe for symbols at extremes builds watchlists and breadth-style context, since how much of a market is stretched at once is itself information.
Overbought/oversold vs neighboring reads
Centerline Regime: Both are oscillator grammar, but the centerline read asks which side of the midline (50 on RSI, zero on MACD) the gauge lives on to define bias. Overbought/oversold asks whether it reached an extreme: midline for regime, extremes for stretch.
RSI Range Rules: Range rules replace fixed 70/30 thresholds with regime-shifted operating bands, such as RSI respecting a higher floor throughout bull phases. Overbought/oversold is the static convention those rules deliberately bend to fit the regime.
Momentum Thrust: A thrust approach buys precisely when the oscillator crosses into overbought, reading the extreme as initiative rather than stretch. Same zones, inverted interpretation, which is why regime classification has to come first.
Bollinger Band Tag Reversion: A band tag measures stretch in price terms, distance from a moving average in standard deviations, while overbought/oversold measures stretch on a bounded oscillator scale. The two often fire together but can disagree after volatility shifts.
Concept family
Momentum & Oscillators
91 concepts mapped · 91 in the Library
Overbought/oversold FAQ
Turn Overbought/oversold into a trading strategy.
Take any implementation from this page into Quant, then build on it, backtest it on real data, and keep refining it in conversation.