Bearish Chart Patterns: What You Need to Know
Bearish chart patterns describe price structures that traders use to investigate a possible decline. Head and shoulders and double tops are commonly studied as reversals after an advance; descending triangles often appear as continuation formations. A recognizable shape is a candidate setup, not a guarantee that price will fall.
This guide explains the structure, confirmation, targets, and risk choices for each pattern. Use Quant Charts, LuxAlgo’s native charting platform, to mark the relevant levels and compare context. Then use Quant to help translate an explicit pattern definition into rules you can inspect and test.
Three Common Bearish Chart Patterns
| Pattern | Structure | A possible confirmation rule | Main risk |
|---|---|---|---|
| Head and shoulders | Three peaks, with the middle peak higher; a neckline joins the intervening lows. | A completed close below the predefined neckline or chosen trough level. | A developing right shoulder can fail to complete; confirmation conventions differ. |
| Descending triangle | Similar support lows beneath successively lower reaction highs. | A completed close below horizontal support. | Price can break upward or reclaim support after a downside break. |
| Double top | Two separated peaks near a similar level, with an intervening valley. | A completed close below the valley low. | Two highs alone can be consolidation before another advance. |
No universal 93%, 64%, or 72% success rate applies to these patterns. A study’s break-even failure rate, frequency of a downside break, average decline, and target-hit rate are different measurements. None can be converted directly into your strategy’s win rate without matching the definitions, market, sample, timing, and costs.
Head and Shoulders: From Candidate to Confirmed Pattern
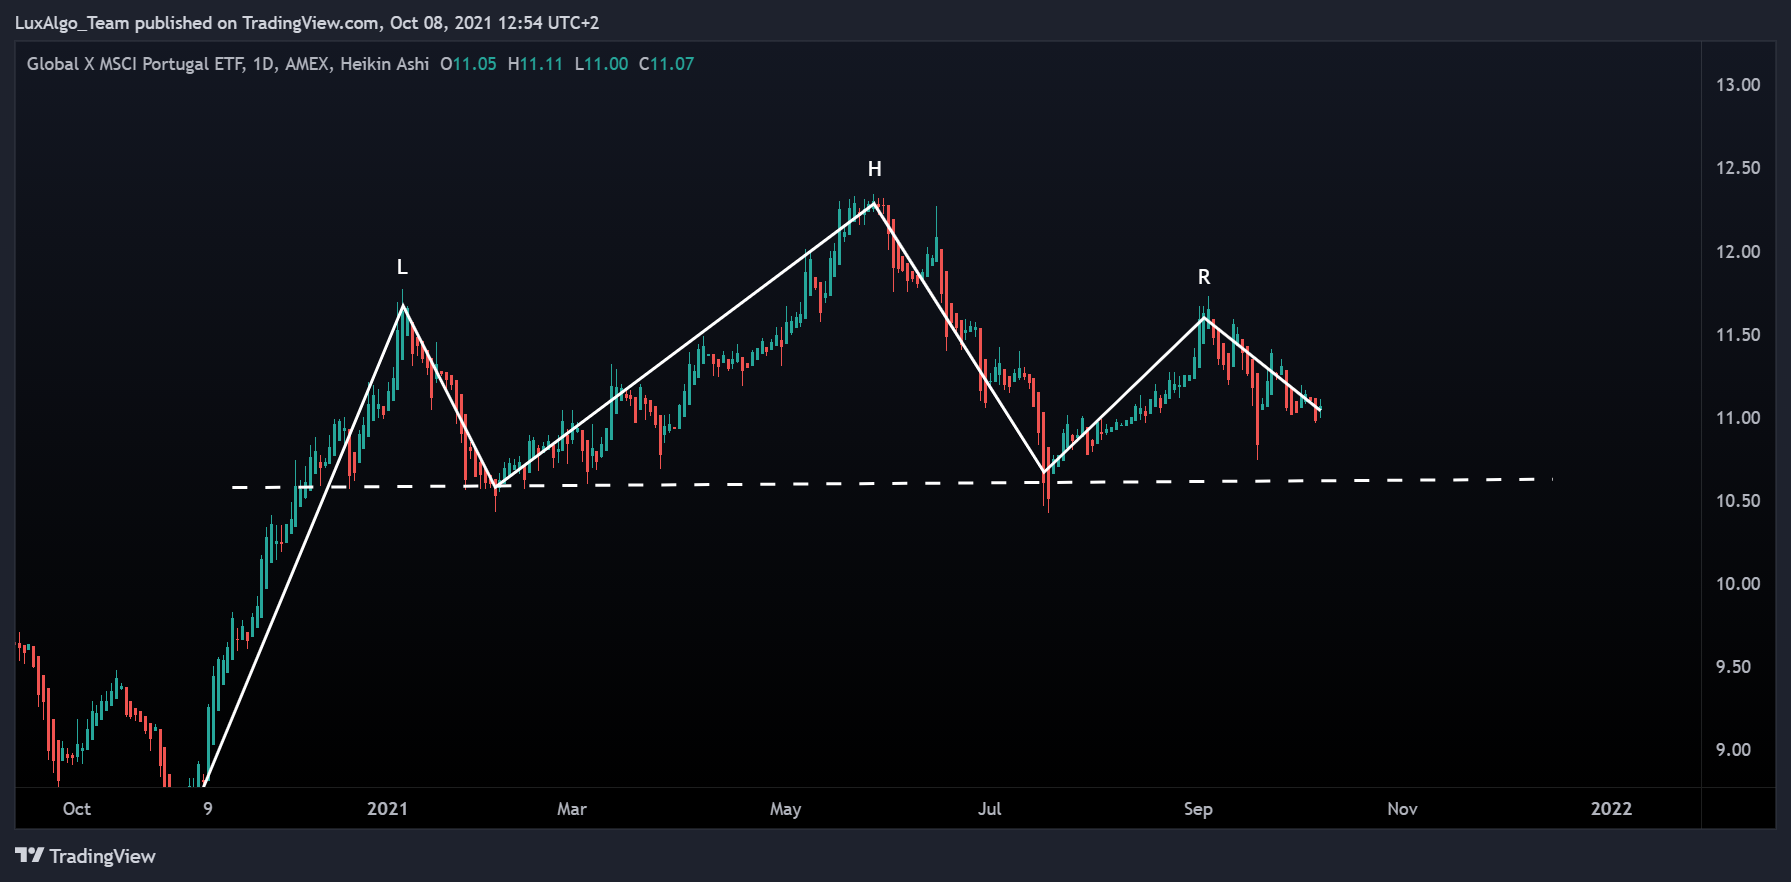
Look for an advance followed by a left-shoulder high, a higher head, and a lower right-shoulder high. The two shoulders are often roughly similar in height, but need not be identical. The neckline connects the two intervening troughs and can be horizontal or sloped. Define acceptable symmetry and pivot spacing before scanning charts.
A close below the neckline is one common confirmation convention. For a sloping neckline, calculate its value at the decision bar rather than using a later extension drawn with hindsight. Some methods use the right-hand trough for a downward-sloping neckline. Bulkowski’s head-and-shoulders research uses that distinction, illustrating why results from different definitions should not be mixed.
Do not enter at the apparent head simply because the completed chart later resembles the pattern. The right shoulder and breakdown have not happened yet. A pivot algorithm that needs later bars to confirm a high must wait for those bars before treating that pivot as known.
Targets and Stops
A conventional measured move takes the vertical distance from the head to the neckline beneath it and projects that distance below the chosen breakout level. For a horizontal neckline at $100 and head at $112, the height is $12 and the full-height projection is $88. It is a reference, not a promised destination or an expected average decline.
A stop above the right shoulder is one structural choice. A closer stop above a breakdown retest is a different strategy with different fill and stop-out behavior. Specify the buffer, entry timing, target, and maximum holding period before testing. Price may reclaim the neckline or rise above the pattern instead of reaching the projection.
Descending Triangle: Lower Highs Above Support
A descending triangle combines at least two reasonably similar reaction lows with lower reaction highs. The support boundary is approximately horizontal; the upper boundary slopes downward. Separate the touches with intervening swings so several adjacent candles are not counted as independent reactions.
It is commonly studied during a downtrend, but can also appear after an advance. A bearish interpretation does not force a downside outcome. For a close-based strategy, the setup remains unconfirmed until a bar closes below the chosen support level. An intrabar wick below support followed by a close above it is a different event.
The StockCharts descending-triangle guide describes contracting volume during formation and expansion on a downside break as supporting context, not a necessary volume rule for every pattern. A return to broken support can occur, but a retest is not guaranteed.
A conventional projection subtracts the pattern’s widest vertical height from support. If the first upper boundary is $54 and support is $45, the height is $9 and the projection is $36. A gap below support can leave much less room between the actual entry and that reference. Recalculate potential reward from the executable entry, not from the ideal drawing.
A stop above the most recent confirmed lower high is one choice. Define what makes the pattern invalid, how long the breakout remains actionable, and whether a close back inside forces an exit. Waiting for a retest may avoid some immediate failures while also missing breaks that never return.
Double Top: Two Peaks Are Only the Beginning
A double top forms after an advance when price makes two separated peaks near a similar level with a valley between them. The second peak can be slightly higher or lower under a specified tolerance. The double-top and double-bottom guide explains the distinction between a candidate pair of peaks and a completed support break.
The bearish confirmation level is the intervening valley low. A completed close below it differs from selling the second peak in anticipation. State the peak tolerance, spacing, required valley depth, and pivot-confirmation delay; exact equality of the highs is not necessary, but an undefined “similar” is hard to test.
| Phase | Observable structure | Volume question to investigate |
|---|---|---|
| First peak | An advance reaches a high. | What is activity relative to the same feed and session baseline? |
| Valley | Price pulls back between the peaks. | Does volume contract, and is that actually part of the rule? |
| Second peak | Price returns near the first peak. | Is activity lower or higher than at the first peak? Neither proves a reversal. |
| Breakdown | Price meets the specified break below the valley. | Does a predefined volume condition pass at the decision time? |
The full-height projection subtracts the distance from the selected peak to the valley from the breakdown level. Choose the higher peak or another fixed convention in advance. A stop above the second peak or the pattern’s highest point changes planned risk; it is not enough to say “use a stop” without stating which level and buffer.
Confirmation: Volume, OBV, RSI, and MACD
Confirmation means the setup has met your stated conditions. It does not mean the outcome is certain. Test optional volume and momentum filters against the same pattern strategy without them, rather than assuming more conditions must improve accuracy.
Volume and On-Balance Volume
Volume can describe participation around a support break. Choose a baseline before the signal. For example, 150,000 units versus an average of 100,000 across the previous 20 completed bars is 1.5 times the baseline, or 50% higher. That is an illustrative filter, not a universal threshold required for a valid break.
Compare like sessions and data sources. A partial current bar should not be compared as if it were a completed bar, and forex tick volume is not consolidated global traded volume. Contradictory descriptions such as always rising throughout formation and always contracting should not be combined into one mandatory rule.
On-Balance Volume adds the bar’s volume when the close rises and subtracts it when the close falls, usually leaving it unchanged for an equal close. A falling OBV reflects that cumulative signed calculation. It does not identify the traders involved or guarantee that a breakdown will continue.
Momentum and Divergence
An RSI reading above 70 at a head or second peak may be a filter to investigate, but a bearish pattern can form without it. RSI can remain elevated during an advance. For MACD, distinguish crossing below the signal line from crossing below zero; those events can occur on different bars.
Bearish divergence requires a defined comparison of price and indicator pivots. If the pivots use later bars to confirm, the signal is only available after that delay. Indicator agreement and multiple views of the same price series are not independent votes that justify a larger position.
Build the Chart Study in Native LuxAlgo
Open Quant Charts and start with a clean view of the instrument. Use native drawing tools to mark the candidate peaks, troughs, neckline, and support. Drawings use time and price anchors, save with the workspace, and can be managed in the Object tree. Freeze the decision levels before judging the later move.
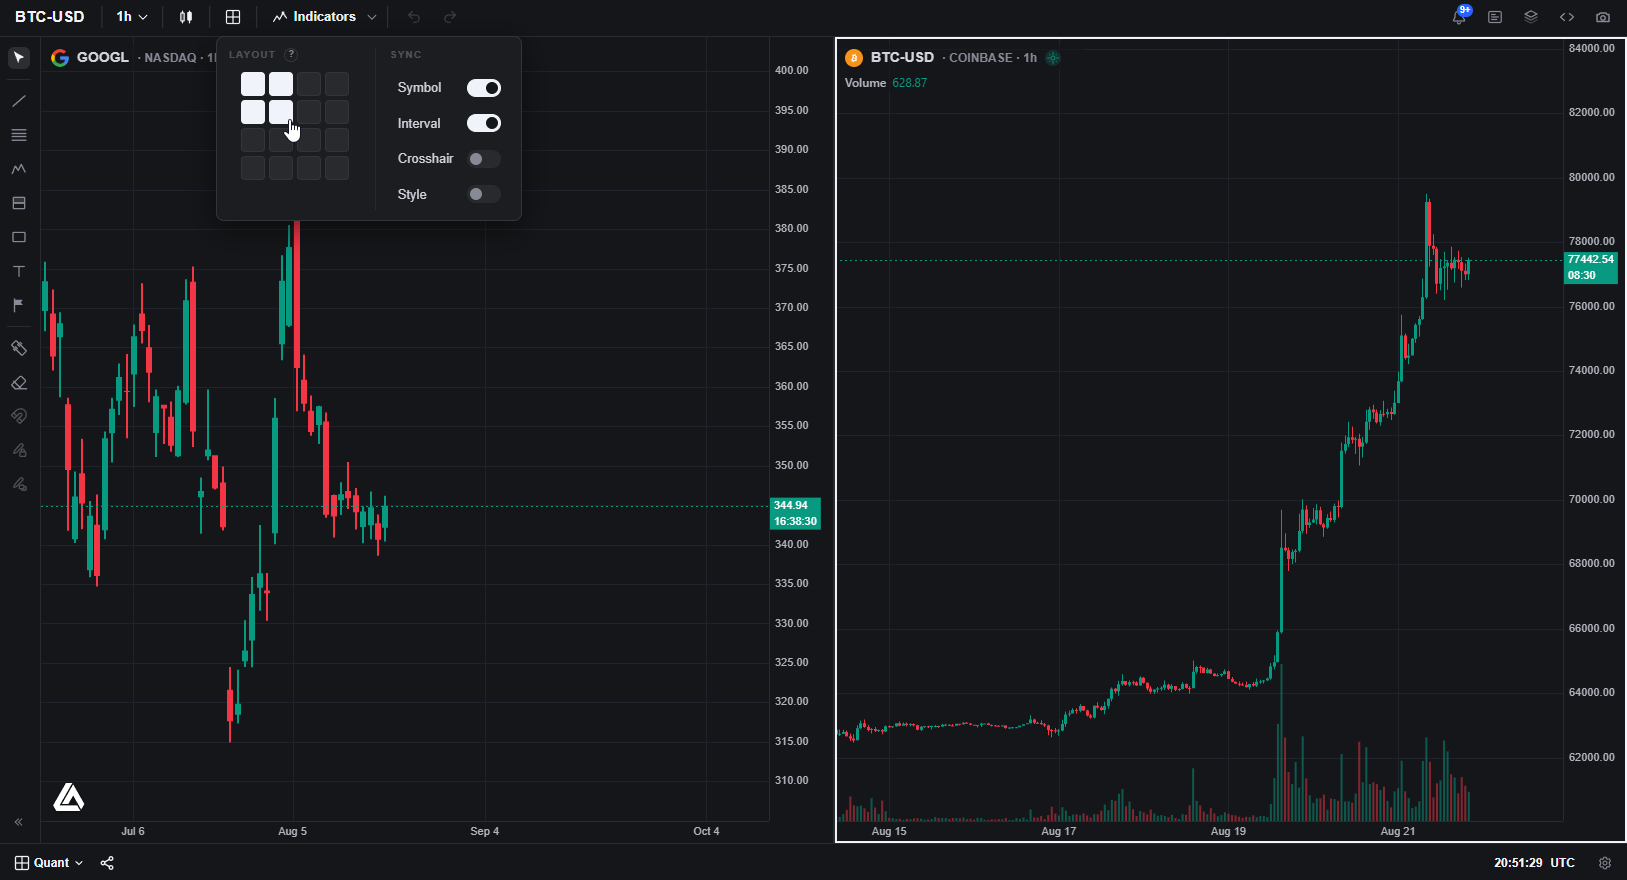
A daily chart can describe the preceding trend, a four-hour chart can define the pattern, and a one-hour chart can define an entry trigger. This is one possible arrangement, not a required hierarchy. Keep the symbol, data source, session, and timezone consistent. A daily candle’s final close is unavailable before that day ends.
Use the native indicator picker to add relevant Basic or LuxAlgo Library studies to the active chart. Save a template for a repeatable comparison. A historical marker is not proof that the signal existed at the displayed pivot time; inspect the study’s definition and confirmation delay.
The Breakouts with Tests & Retests library study classifies interactions with swing-derived areas using opens and closes. Its labels are not a general certification that every chart-pattern break is valid, and a retest is not automatically a failed breakout. Match the study’s event definition to the strategy you actually want to test.
Risk and Execution: A Worked Short Example
For a hypothetical double top, suppose valley support is $100. A completed close breaks below it, and the next open fills a short at $99.50. A planned stop is $102.50 and a target is $93.50. Price risk is $3 per share and potential gross reward is $6 per share, or 2R.
A $150 price-risk budget permits 50 shares before costs and execution allowances. If total trading costs are $10, a stop filled exactly at the planned price gives a modeled $160 loss, while a target fill gives $290 net profit. The net reward-to-loss ratio is about 1.81, not 2. A gap or worse fill can increase the loss.
An ATR-based stop is another possible rule, but 2–3 ATR and risking 1–2% of capital are not universally suitable prescriptions. Specify the ATR period, multiplier, position size, and total portfolio exposure, then evaluate the resulting losses. A wider stop generally requires less size for the same planned price-risk budget.
A stop order does not guarantee its trigger price. A stop-limit order may not execute. Short stock positions also depend on borrow availability, fees, margin, and potential recall; losses can exceed the initial proceeds as price rises. A bearish observation can support reviewing an existing long position or avoiding a new entry without requiring a short trade.
Turn One Pattern into Testable Rules with Quant
Ask Quant, our coding agent to code an explicit specification. For example, define confirmed pivots, peak tolerance, valley depth, maximum pattern duration, a completed support break, next-bar entry, a fixed stop reference, a target, and a time exit. Decide whether a pattern can trigger more than once.
Inspect the generated code and run manually in the native strategy workflow. Check that later-confirmed pivots are not used prematurely, entries occur after the actual trigger, and targets and stops use information available at the time. Include costs and inspect individual trades against standard price candles.
Separate the period used to choose settings from a later evaluation period. Record all qualifying patterns, failures, skipped trades, and missed fills. A 90% recognition score is not a trading objective unless the labeled dataset and scoring method are defined, and a 2R target does not imply positive expectancy.
- Recognition: can another person or the code reproduce the same pivots and boundaries?
- Timing: when did the full setup become knowable, and when could an order actually fill?
- Risk: what happens if price gaps, a retest never arrives, or a short cannot be borrowed?
- Results: compare net return, drawdown, trade count, exposure, and average win and loss.
- Review: change one filter at a time and retain the baseline for comparison.
Use a trading journal to document the chart, rule version, entry, exit, costs, and deviations. Review on a regular schedule without retuning after every loss.
Head and Shoulders Trading Course: Video Example
The retained Wysetrade tutorial, ULTIMATE Head And Shoulders Pattern Trading Course (PRICE ACTION MASTERY), provides visual examples of the formation. Treat its historical setups as educational illustrations and reproduce the timing and risk assumptions before relying on a trading rule.
Frequently Asked Questions
How do you trade using a double top pattern?
Define two separated peaks near a similar level and the valley between them. A close below the valley is one confirmation rule. Specify entry timing, stop reference, target, sizing, and expiry before testing; the second peak alone is not confirmation.
Is the double top pattern effective?
Effectiveness depends on the exact definition, market, period, execution, and costs. Volume or momentum filters may change results but do not guarantee an improvement. Evaluate all qualifying setups rather than selected winning examples.
What is the trading approach for a head and shoulders pattern?
Identify the three peaks and neckline, then wait for the chosen completed-break rule. A stop above the right shoulder and a full-height projection are possible references, not guarantees. Sloping necklines require an explicit confirmation convention.
How can you spot a head and shoulders pattern early?
A higher central peak followed by a lower right-side peak can form a candidate after an advance. The pattern is not complete until its confirmation condition occurs. Pivot confirmation may require additional bars, and the candidate can fail.
Can Quant help test bearish chart patterns?
Quant can help code explicit pivot, pattern, entry, exit, and sizing rules. Inspect the generated code for recognition delays and future-data use, run manually, and check individual trades, costs, and later-period results.
Read next