Chop Zone Indicator: Identifying Choppy vs Trending Markets
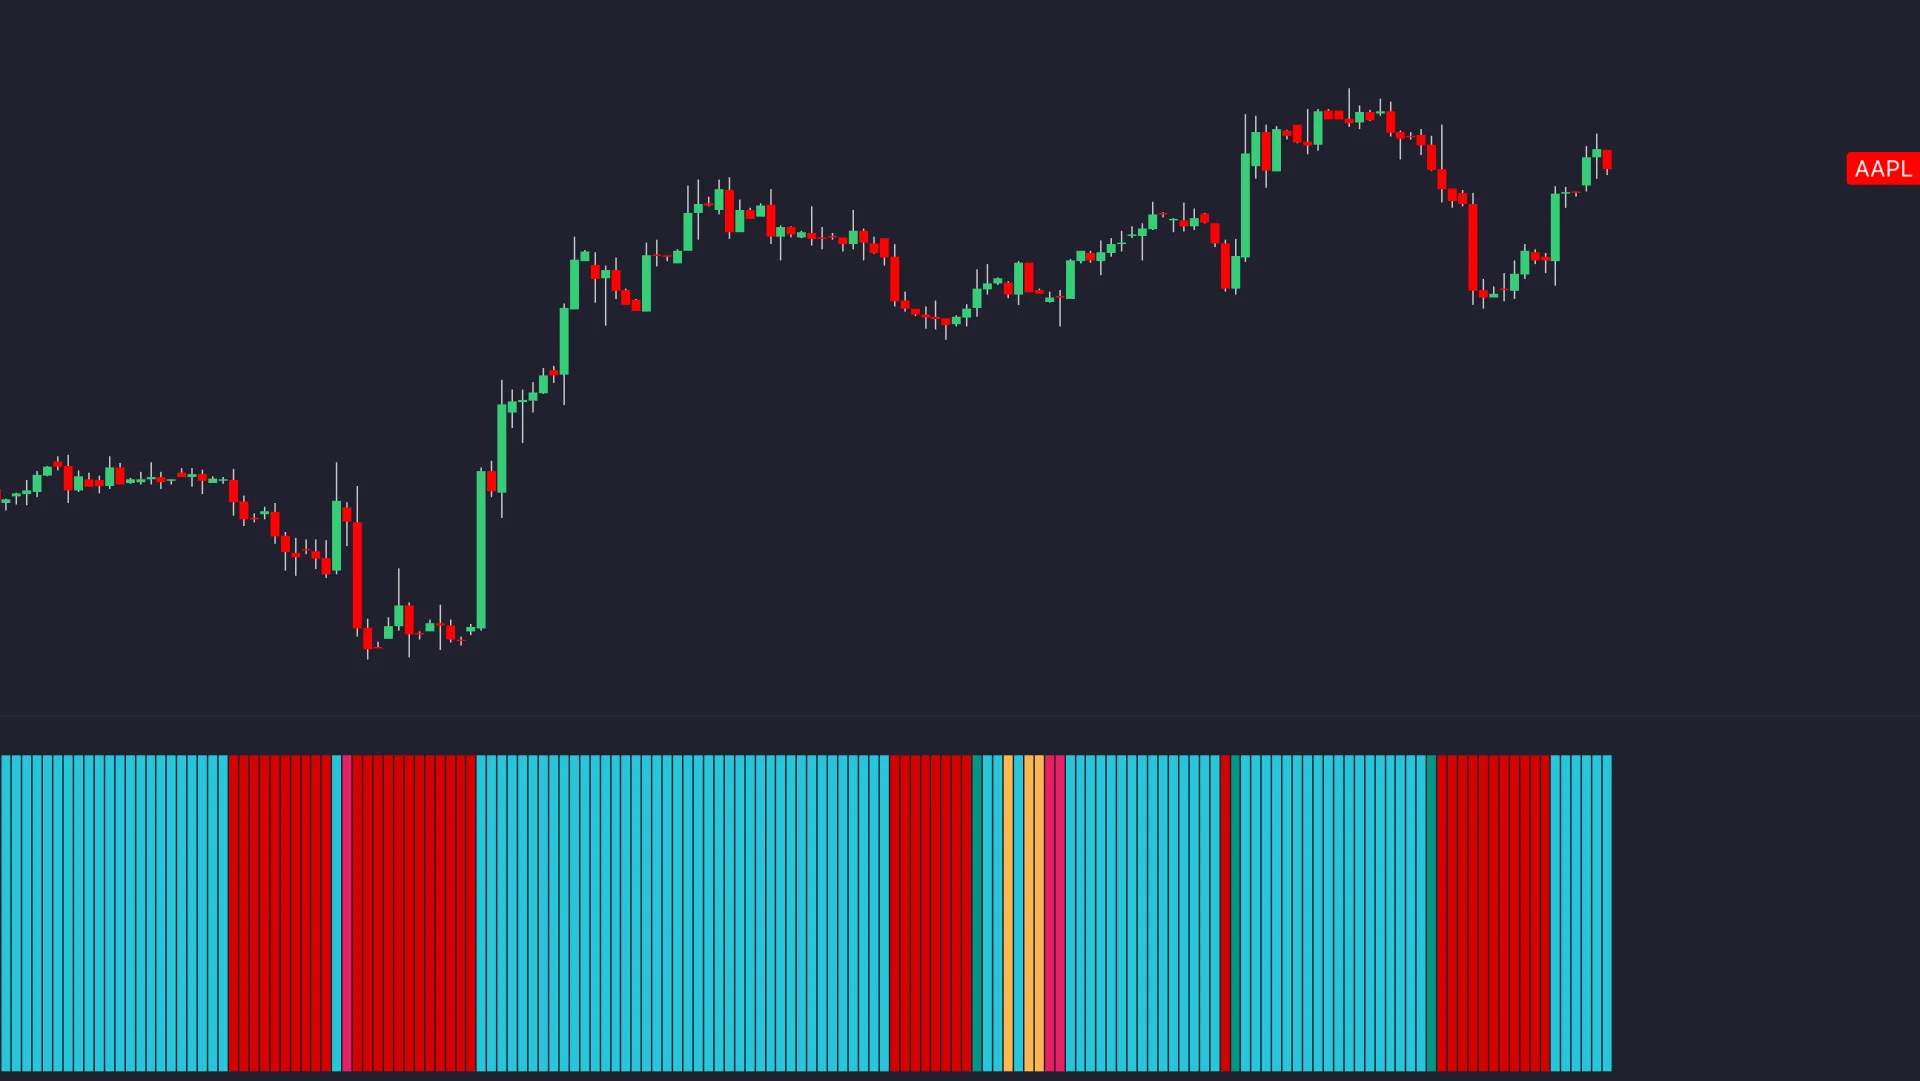
The Chop Zone indicator is a TradingView study that colors a strip of bars beneath price to show whether the market has been trending or moving sideways. It works from the relationship between price and an exponential moving average, scaled between −100 and +100, and converts the result into colors: turquoise and green shades while the average is rising steeply, red shades while it is falling, and yellow or orange readings when it is close to flat. It is a visual regime read, not an entry signal.
A second tool with a similar name measures chop differently. The Choppiness Index (CHOP) is E.W. Dreiss’s 0-to-100 gauge of how efficient recent price movement has been; readings above 61.8 are conventionally called choppy and readings below 38.2 trending. The two are often confused, and this guide covers both so that the numbers attached to each are the right ones.
- Chop Zone: directional. Colors say whether the average is rising, falling or flat; the yellow band marks chop.
- Choppiness Index: direction-blind. It says whether a trend exists, never which way it points.
- Both summarize a window of past bars and confirm a regime after it has formed; neither predicts the next move.
The practical use of either is as a filter: trend-following entries are taken when the regime read says trending and stood down when it says choppy. Whether that filter improves a strategy is a question for a backtest. The LuxAlgo Choppiness Index in the Library opens on Quant Charts in one click, and Quant, our coding agent, can help add a regime condition to a strategy so the filtered and unfiltered versions can be compared. Inspect the Code and click Run.
How the Chop Zone Indicator Works
Understanding the Calculation
TradingView describes its Chop Zone as a visual indicator designed to analyze trends and identify their choppiness. It is plotted within −100 and +100 and responds to the difference between the close and its exponential moving average, converting the calculated values into colors. The closer the reading is to +100, the more choppiness is registered; the closer to −100, the stronger the trend. The help page lists no adjustable inputs, and the built-in is generally described as working from a fixed 34-period EMA, so the study is read rather than tuned.
The Choppiness Index is a different calculation. Over a lookback of n bars, it sums each bar’s true range, divides by the window’s total high-to-low range, takes the base-10 logarithm and normalizes by the logarithm of n:
CHOP = 100 × log10( Σ TrueRange(n) ÷ (Highest High(n) − Lowest Low(n)) ) ÷ log10(n)
The ratio inside the logarithm compares path traveled with ground covered. Bars that swing back and forth inside a narrow span travel a long path for little net progress and push the index toward 100; bars that stack in one direction travel about as far as they progress and pull it toward 0. The default length is 14, and the LuxAlgo Library’s Choppiness Index concept notes that the numerator is a sum of single-bar true ranges, not a smoothed ATR.
| Hypothetical 14-bar window | Sum of true ranges | Highest high − lowest low | Ratio | CHOP |
|---|---|---|---|---|
| Efficient trend | $28 | $21 | 1.33 | 10.9 |
| Mixed | $42 | $12 | 3.50 | 47.5 |
| Congested range | $56 | $10 | 5.60 | 65.3 |
The index is bounded by construction. If the path equals the net range, the ratio is 1 and CHOP is 0; if the bars overlap almost completely, the ratio approaches n and CHOP approaches 100. The 61.8 and 38.2 thresholds are Fibonacci conventions rather than statistical properties, and some traders substitute 60 and 40 or percentile cutoffs calibrated to the instrument.
The Color-Coded System Explained
The Chop Zone strip is a color scale rather than a three-state histogram. Turquoise and the green shades appear while the moving average is rising, with turquoise for the steepest rise; red shades appear while it is falling, with the darkest red for the steepest decline; yellow and orange sit near zero, where the average is close to flat. Because the scale is signed, the strip carries direction, which is what separates it from the Choppiness Index.
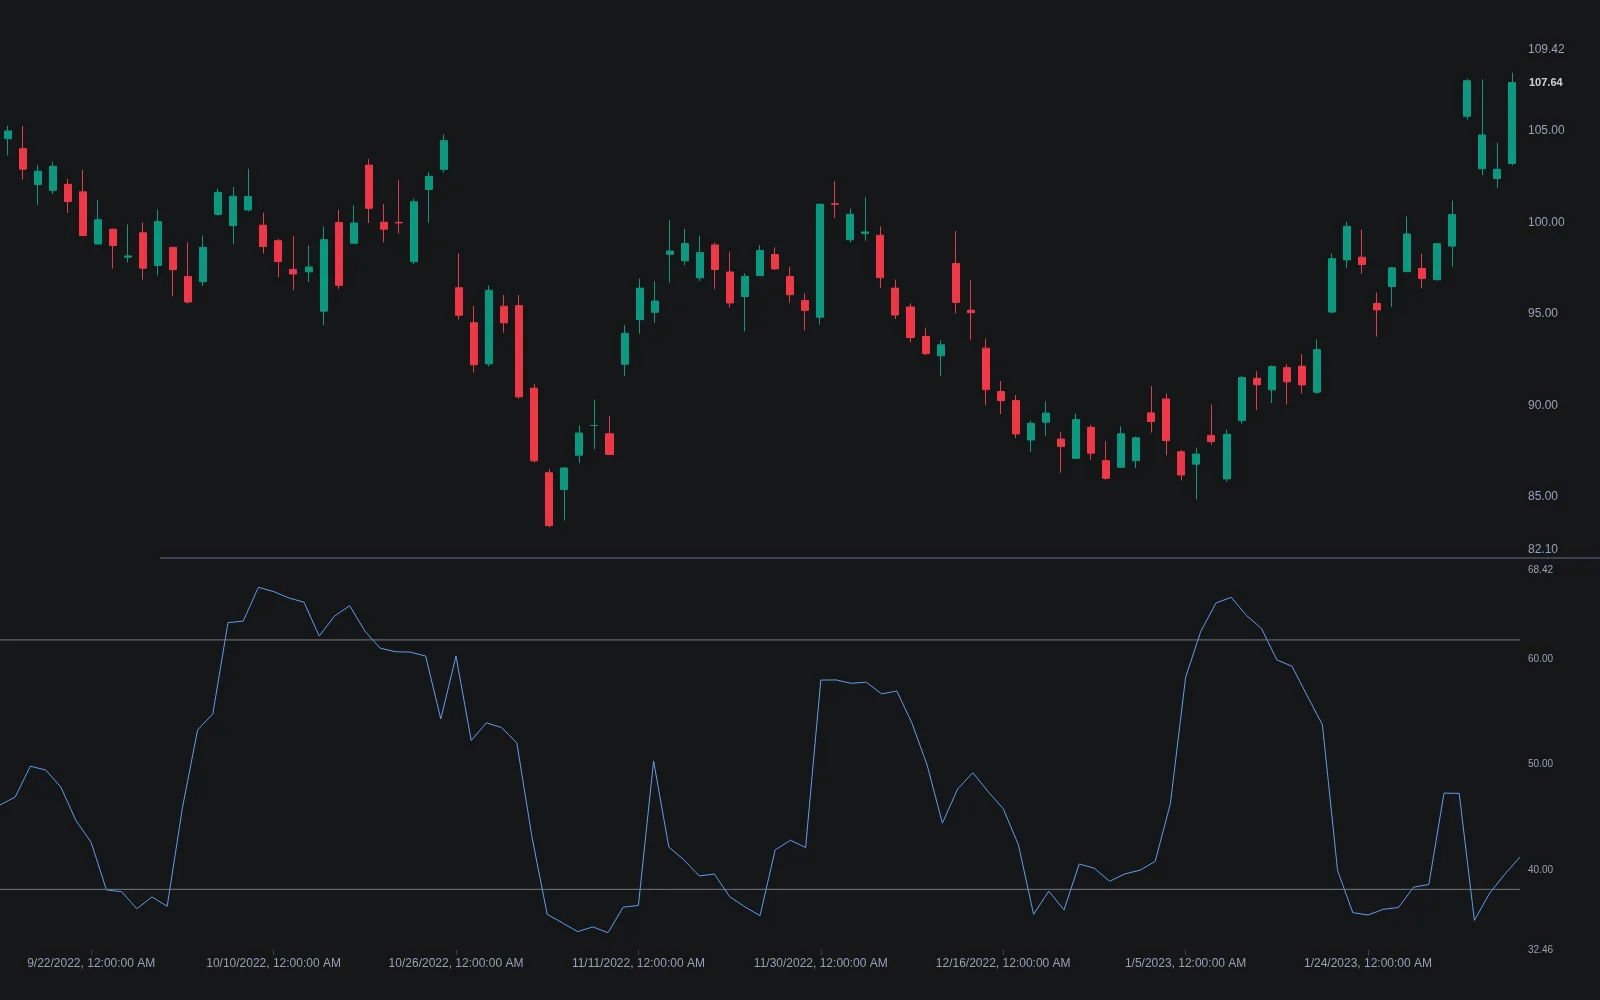
The Choppiness Index has no colors of its own. It is read against two levels, and the LuxAlgo build shades the zone between them.
| CHOP reading | Conventional label | Common tactic | What it does not tell you |
|---|---|---|---|
| Above 61.8 | Choppy, range-bound | Range tactics, fade extremes, stand down on fresh trend entries | Which way the range will resolve |
| Between 38.2 and 61.8 | Ambiguous | No regime has claimed the tape; defer to other evidence | Whether the next reading rises or falls |
| Below 38.2 | Efficiently directional | Trend entries and trailing exits favored | The direction of the trend, which must come from price or a directional tool |
How to Read the Indicator on Charts
- Single readings are snapshots. A lone yellow bar or one CHOP value above 61.8 tells you little; both indicators are computed from a window and drift by one bar at a time.
- Duration carries the information. A long run of turquoise, or a long stay below 38.2, marks a persistent trend; a long stay above 61.8 marks a mature consolidation of the kind that often precedes an expansion, in either direction.
- Rollovers matter more than levels. CHOP turning down from a high reading says rotation is giving way to progress; a color strip shifting from yellow toward turquoise or red says the average has started to lean.
- Lag is built in. Both tools summarize the whole window, so an explosive breakout bar takes several bars to pull CHOP down or to turn the color strip fully.
- Multiple timeframes can disagree legitimately. A trending daily reading with a choppy hourly reading describes consolidation inside a larger move, and the tactic can differ per timeframe.
Read either tool beside price rather than instead of it. A regime indicator confirms what the last n bars did; the decision about the next bar still comes from the trading rule, its stop and its size.
Using the Chop Zone Indicator in Trading
Identifying Trending vs. Choppy Market Conditions
The cleanest use is a written regime rule. For the Choppiness Index that might read: take trend-following entries only when the 14-bar CHOP is below 38.2 at the time of the signal, and take no new trend entries while it is above 61.8. For the Chop Zone it might read: take longs only while the strip is turquoise or green, shorts only while it is red, and nothing while it is yellow or orange.
Both rules will keep you out of some good trades and in some bad ones. Consolidations produce the false breakouts that hurt trend systems, so a filter that stands down during congestion can raise the average quality of the remaining trades. It also delays re-entry after a trend begins, because the regime read confirms late. Whether the trade-off pays is specific to the strategy and the market.
Position size is a second lever. Some systems scale trend-trade size down as CHOP rises rather than switching entries off, on the logic that a signal inside congestion carries worse odds than the same signal in an efficient tape. That keeps participation while shrinking the cost of being early.
Combining with Other Technical Indicators
- Direction: the Choppiness Index needs a directional partner. Price structure, a moving average slope, or the ADX and DMI system supply the side; low CHOP with rising ADX is a stronger trend vote than either alone.
- Volatility level: CHOP measures path efficiency, not size. A fast one-way collapse prints low CHOP with wide Bollinger BandWidth; a tight, whippy range prints high CHOP with narrow bands. Read the two together to separate quiet chop from violent trends.
- Related efficiency reads: the Kaufman efficiency ratio runs from 0 for pure chop to 1 for a perfect trend, the mirror of CHOP’s orientation, and is mostly used inside adaptive averages.
- Momentum: an oversold or overbought reading on RSI means different things in a trend and in a range. Regime tools help decide which interpretation applies, which is where they earn their place.
The Library’s market-structure tools run their own structure calculations. A structure label appearing while a regime tool reads trending is a coincidence to test, not a combined signal, and no tool here identifies institutional activity.
Best Practices for Strategy Integration
Treat the filter as a testable hypothesis. Run the base strategy without it, then with it, over the same history and costs, and compare trade count, expectancy and drawdown. Consider a hypothetical trend strategy that produced 40 trades in a year: 25 taken while CHOP was below 38.2 averaged +0.35R and 15 taken while it was above 61.8 averaged −0.40R. Unfiltered expectancy is (25 × 0.35 − 15 × 0.40) ÷ 40 = +0.07R per trade; the filtered version keeps only the 25 trades at +0.35R. That is the kind of difference a regime filter is meant to create, and it has to survive a period the rule was not fitted to.
Record the exact definition tested: the length, the thresholds, whether the reading is taken at the signal bar or the entry bar, and what happens to an open trade when the regime changes. A filter that only gates entries behaves differently from one that also forces exits, and a backtest that mixes them cannot be reproduced.
On Quant Charts, open the Choppiness Index from its Library page and read its two alert conditions, Trending Market when the index crosses below the lower band and Choppy Market when it crosses above the upper band. To test the filter, describe the complete strategy to Quant, including the regime condition, inspect the Code and click Run. The Making Strategies with Quant guide shows the workflow and the native backtest guide explains the Backtest Summary: net profit, trade count, maximum drawdown and profit factor, with commission and slippage set in the strategy properties.
Pros and Cons of the Chop Zone Indicator
Key Benefits
Regime tools answer a question most indicators skip: is this the kind of market my rule was built for? A color strip or a bounded index makes that question answerable at a glance and without discretion, and both can be written into a rule and tested. The Choppiness Index adds two useful properties: its scale is fixed at 0 to 100 regardless of instrument or length, and it is indifferent to direction, so it can gate long and short rules symmetrically.
Standing down during congestion also addresses overtrading directly. Trend systems lose most of their money in ranges, and a filter that reduces exposure there can improve results even if it never adds a single winning trade.
Potential Drawbacks
Both tools lag. They describe the window that just ended, so they confirm a trend after part of it has passed and call a range after several bars of it have printed. The Chop Zone’s fixed construction cannot be tuned to a market, and its colors tempt readers to treat a shade change as a signal. The Choppiness Index tells you nothing about direction or about the size of moves, and its thresholds are conventions that may not suit a given instrument.
The evidence for either as a standalone edge is thin. Their value shows up, if at all, in the difference between a filtered and an unfiltered strategy on your own market, which is why the comparison above matters more than any general claim about accuracy.
Comparison Table: Pros and Cons
| Pros | Cons |
|---|---|
| Objective regime read that can be written into a rule | Lagging by construction; confirms regimes late |
| Chop Zone shows direction and slope at a glance | Chop Zone has no adjustable inputs and invites reading shades as signals |
| Choppiness Index is bounded 0 to 100 and comparable across markets | Choppiness Index carries no direction and no volatility level |
| Reduces exposure in congestion, where trend systems lose most | Delays re-entry when a new trend starts |
| Easy to test as a filter against the same strategy without it | Thresholds are conventions; results depend on market and length |
Conclusion and Key Takeaways
What the Chop Zone Indicator Brings to the Table
The Chop Zone turns the slope of a moving average into a color strip, and the Choppiness Index turns path efficiency into a bounded number. Both describe the regime of the recent window, and both are most useful as conditions attached to a strategy that already has its own entries, exits and sizing.
Keep the two straight. The 61.8 and 38.2 levels, the 14-bar default and the true-range formula belong to the Choppiness Index; the −100 to +100 scale and the turquoise-to-red palette belong to the Chop Zone. Mixing their vocabularies produces rules that cannot be tested.
Practical Tips for Using the Chop Zone Indicator Effectively
- Write the regime rule down, including the exact reading and the bar it is taken on, before looking at results.
- Test with and without the filter on identical history and costs, and read trade count and drawdown alongside expectancy.
- Add direction separately. The Choppiness Index needs a directional partner; the Chop Zone’s colors are not entry signals on their own.
- Keep the lag in mind. Use longer lengths for slow regime dials and shorter ones for quick pauses, and expect early trend bars to be missed either way.
- Use Quant Charts for the comparison. The native Choppiness Index and its alerts are available from the Library, and Quant can help add the condition to a strategy you then inspect and run.
FAQs
Is the Chop Zone the same as the Choppiness Index?
No. TradingView’s Chop Zone colors bars from the relationship between price and an exponential moving average on a −100 to +100 scale and carries direction. The Choppiness Index is a 0-to-100 efficiency measure with 61.8 and 38.2 reference levels and no direction.
What do the Chop Zone colors mean?
Turquoise and green shades appear while the moving average is rising, red shades while it is falling, and yellow or orange readings when it is close to flat, which is the choppy zone. The strip is a scale of slope, not a set of entry or exit signals.
What do 61.8 and 38.2 mean on the Choppiness Index?
They are conventional Fibonacci-derived cutoffs: readings above 61.8 are labeled choppy, readings below 38.2 trending, and the band between them ambiguous. Nothing is exact about the numbers; some traders use 60 and 40 or percentile cutoffs for their market.
Can I change the Chop Zone settings?
TradingView’s help page lists no inputs for the built-in, which is generally described as using a fixed 34-period EMA, so it is read rather than tuned. The LuxAlgo Choppiness Index, by contrast, exposes Length, Upper Band and Lower Band as inputs.
How should I combine a regime indicator with other tools?
Pair the Choppiness Index with a directional tool such as price structure or ADX, and with a volatility gauge such as BandWidth, since it measures efficiency rather than size. Then test the combined rule against the same strategy without it before relying on it.
Can I test a Choppiness Index filter on Quant Charts?
Yes. Open the Choppiness Index from the Library with Open on Quant Charts, describe the strategy and the regime condition to Quant, inspect the Code and click Run. Compare the Backtest Summary with and without the filter, with commission and slippage entered.
References
LuxAlgo Resources
- Quant Charts
- LuxAlgo Quant
- Choppiness Index Indicator
- Choppiness Index Concept
- ADX and DMI System
- Bollinger BandWidth
- Kaufman Efficiency Ratio
- Making Strategies with Quant
- Native Backtest Guide
- Understanding Moving Averages
- Understanding RSI
External Resources
Read next