How to Use Candlestick Patterns for Pullback Signals
A pullback setup looks for a temporary move against a defined trend, followed by evidence that the trend may resume. Candlestick patterns can describe that evidence, but the market may continue against you. Define the trend, pattern, detection time, entry and exit before judging a setup by its outcome.
For an uptrend, a bullish pattern after a local decline can support a continuation hypothesis. For a downtrend, a bearish pattern after a local rally can serve the opposite role. The candlestick formation reverses the local countertrend move; it does not prove that the broader trend remains intact. Use native LuxAlgo charts to inspect these conditions and Quant, our coding agent, to help translate them into explicit strategy rules.
Six Candlestick Patterns to Evaluate
The StockCharts candlestick dictionary distinguishes formations by their candle geometry and preceding price action. A pattern name is not a complete trading system. Specify numerical body and shadow thresholds, the local trend requirement and whether gaps are required in your implementation.
| Pattern | Local formation | Pullback hypothesis |
|---|---|---|
| Bullish Engulfing | A bullish body covers the preceding bearish body | Potential end to a decline inside a defined uptrend. |
| Hammer | Small body near the top, long lower shadow, little upper shadow | Possible rejection of lower prices after a local decline. |
| Morning Star | Bearish candle, small star body, then bullish recovery into the first body | Potential turn after a local decline; define the gap requirements. |
| Bearish Engulfing | A bearish body covers the preceding bullish body | Potential end to a rally inside a defined downtrend. |
| Shooting Star | Small body near the bottom, long upper shadow, little lower shadow | Possible rejection of higher prices after a local rally. |
| Evening Star | Bullish candle, small star body, then bearish close into the first body | Potential turn after a local rally; define the gap requirements. |
Engulfing: Compare Real Bodies
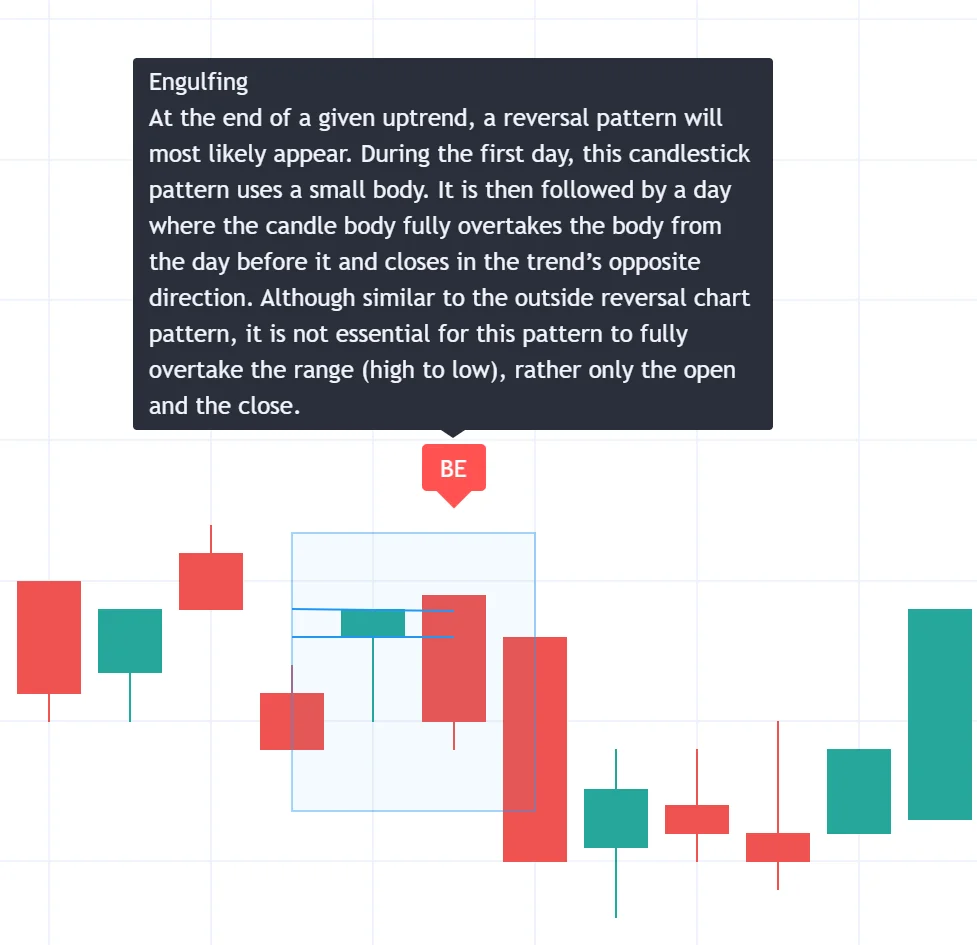
The real body runs from open to close. An engulfing pattern does not require the second candle’s entire high-to-low range to contain the first. For a strict bullish example, a bearish body from open 104 to close 102 is followed by a bullish body opening 101.5 and closing 104.5. Reverse the direction for a bearish example. State whether equality at either boundary qualifies.
A large red candle alone is not necessarily bearish engulfing. Check the preceding bullish body, local rally and exact open/close relationship. Nor does detecting a bearish pattern establish a 59.38% chance of a negative return ten days later. Any such statistic requires a reproducible sample, pattern definition, horizon and treatment of costs.
Hammer and Shooting Star: Measure the Shadows
For a candle with open O, high H, low L and close C, body length is |C − O|, upper shadow is H − max(O,C), and lower shadow is min(O,C) − L. A hammer has a relatively small body near the upper end; a shooting star has the mirrored shape. The same geometry has different names and interpretations in different local trend contexts.
One illustrative hammer rule requires a lower shadow at least twice the body and an upper shadow no longer than one-quarter of the body. With O = 100, C = 101, H = 101.2 and L = 97, the body is 1, lower shadow 3 and upper shadow 0.2. Those values pass that particular geometry rule. A body of zero requires a separate doji rule rather than division by zero.
A mirrored shooting-star example uses O = 101, C = 100, H = 104 and L = 99.8. It has an upper shadow of 3 and lower shadow of 0.2. These thresholds are examples to test, not universal optimal settings. A small body and long shadow describe prices within the bar; they do not identify which institutions traded or guarantee the next move.
Morning and Evening Stars: Wait for All Three Candles
A morning star begins with a substantial bearish body, followed by a small body below it and a bullish third candle that recovers into the first body. An evening star mirrors the sequence after a local advance. A common completion criterion uses a third-candle close beyond the midpoint of the first real body in the reversal direction.
For an evening-star body example, the first candle opens at 100 and closes at 104, the second has a small body from 105 to 105.2, and the third opens at 104.8 and closes at 101.5. The first body’s midpoint is 102, so the third close is below it. The second body is separated above the first; specify whether the third opening must also gap below the star body. Wick gaps and body gaps are different conditions.
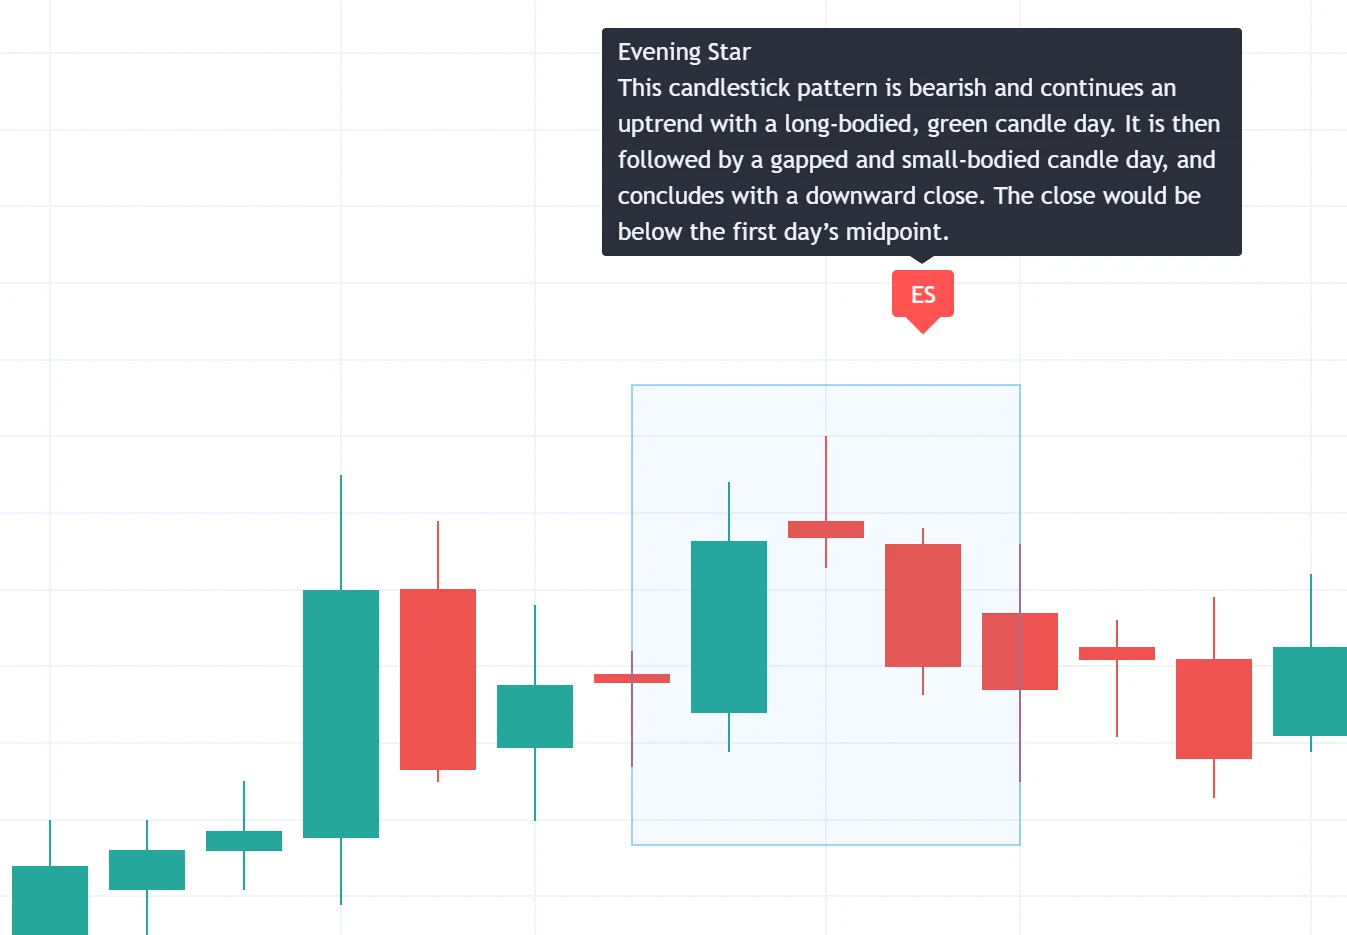
Classical star definitions include gap conditions. If you relax those requirements for continuously traded markets or intraday data, label and test the modified rule explicitly. A three-candle sequence is unavailable as a completed pattern until its third candle closes. A large later reversal must not be used to retroactively choose only attractive examples.
Video: Hammer and Shooting Star Examples
Wysetrade’s 10-minute, 6-second tutorial illustrates hammer and shooting-star geometry and trading context. Use it alongside explicit numerical criteria. The displayed examples and promotional title do not establish a success rate or replace testing the complete pullback strategy.
Assign a Clear Role to Each Timeframe
Start with an objective trend definition. For example, a study might require the last completed daily close above a rising daily moving average, then search for a local decline and bullish pattern on a lower timeframe. Define the moving-average length, slope comparison and local-decline condition. This is one hypothesis, not a rule that fits every market.
| Timeframe | Possible role | Timing requirement |
|---|---|---|
| Daily | Broader trend and major reference levels | Use the most recent completed daily condition. |
| 4-hour | Optional intermediate structure or setup | Use only completed bars available at the decision time. |
| 1-hour | Pattern completion and later entry trigger | Record pattern close, trigger and eligible fill separately. |
You do not need all three timeframes. If the daily candle itself contains the pattern, it cannot guide an entry earlier that same day using its final close. Set exchange session, timezone and higher-timeframe update rules consistently. Historical access to a finished candle does not mean its final values were available during its formation.
Additional timeframes may remove trades, delay entries or change exposure. Compare the base strategy and added filter on identical dates and data. There is no supported universal 62% improvement from using multiple timeframes, and agreement among several price-derived conditions is not independent proof of a reversal.
Use Volume and Retracement Levels as Defined Filters
A volume condition needs a denominator. For example, require the completed signal candle’s volume to exceed 1.5 times the mean of the preceding 20 completed candles. Decide whether the current candle is excluded from that average. This is a test specification, not a recommended universal threshold.
Available volume may be exchange-specific traded volume or tick activity. It does not automatically establish buying pressure or institutional conviction. A rally on increased volume can continue against a bearish hypothesis, and a valid candlestick pattern can form without unusually high volume.
For a measured rise from 100 to 120, retracement prices are calculated from the high: 120 − 0.382 × 20 = 112.36, 120 − 0.5 × 20 = 110, and 120 − 0.618 × 20 = 107.64. The 50% midpoint is commonly included in retracement tools but is not itself a Fibonacci ratio. These are price references, not assured reversal zones.
State which swing anchors are used and when they became known. A hammer near 107.64 is a combination of two conditions; whether it improves results is an empirical question. RSI and MACD filters similarly need exact lengths, thresholds and timing. Add one condition at a time instead of assuming more confluence always helps.
Choose an Entry Method before the Setup Develops
Breakout Entry
A bullish method can require a completed close above the pattern high and enter at the next eligible price. A bearish method can require a completed close below the pattern low. A stop-entry order triggered intrabar is a different execution rule. Do not combine whichever fill assumption produces the better historical outcome.
Waiting for an additional move may reduce the number of candidates but can worsen entry price and increase stop distance. It does not guarantee fewer losing trades. Specify expiration if the trigger never occurs, and model gaps through an entry level.
Retest Entry
After a defined break, a retest method waits for a return to a stated price area. Specify the permitted distance from the reference price, maximum waiting bars and whether an additional completed rejection candle is required. A simple limit order and an entry after a rejection close are different strategies.
A retest may never occur. A tighter stop is possible only if the written exit rule supports it; it is not an automatic advantage. Include untouched limit orders and retests that fail rather than counting only the examples that resumed the trend.
Early Entry
An early method enters before the later breakout trigger. It may use a completed pattern, a limit price within its range, or an intrabar condition, but these must be distinguished. If you act while the pattern candle is still forming, its final shape is unknown. A limit near a midpoint can remain unfilled.
Define the initial size, additional entries and total risk if scaling in. An earlier price is not necessarily a better trade. No reproducible evidence here supports attributing a 58% success rate to early 61.8% entries with PAC alerts, so evaluate the specified method directly.
Calculate Stops, Quantity and Realized Risk
A structural stop and an ATR buffer are separate inputs. For a long trade, one example sets the stop below the pattern low by a chosen ATR multiple. For a short trade, the stop is above the pattern high. There is no universal requirement to add 1–2 ATR or risk 1–2% of capital on every setup.
For share-based examples, quantity = (cash risk budget − estimated cost allowance) ÷ |entry − planned stop|. The absolute price distance handles long and short trades; a zero distance is invalid. Futures and forex require contract size, point value and currency conversion. Exposure, margin and planned loss are different quantities.
Suppose a long entry is 110, the pattern low is 107, ATR is 2 and the chosen buffer is 0.5 ATR. The stop is 106, creating $4 of price risk per share. A $100 budget with $12 reserved for estimated costs permits 22 shares. Notional exposure is $2,420. If an exit gaps to 104, the price loss is $132 before costs, exceeding the planned budget.
Short exits can also gap above the stop, and borrowing availability and fees can affect a short strategy. Several correlated positions may lose together. A stop and fixed sizing rule make the plan explicit; they do not ensure a fixed realized loss.
Separate Target Prices from Risk Multiples
A prior swing high is not necessarily 1R above a long entry. With entry 110 and stop 106, 1R is 4: price targets at 114, 118 and 122 correspond to 1R, 2R and 3R before costs. The previous high at 120 is 2.5R. Calculate the relationship rather than assigning a risk multiple to a level by name.
A 161.8% projection also needs explicit anchors. Taking the 100-to-120 impulse length of 20 and projecting 1.618 times it from a pullback low of 110 gives 142.36. Measuring from the original low instead gives a different price. A projection is a geometric reference, not a forecast or a mandatory profit target.
If half a position exits at 1R and half at 3R, the combined gross gain is 2R only when both targets fill as planned. Moving a stop to entry after 1R does not guarantee a cost-free result and may stop out trades that later resume. Specify the sequence, remaining size, trailing reference and update timing. A trailing stop should not loosen simply because the current ATR increases.
Use the Right LuxAlgo Tool for the Question
Open native LuxAlgo charts and select studies through the Indicators picker. Check the data feed, candle settings and numerical values behind each label. Save a consistent setup and compare only completed higher-timeframe information.
The Library’s Candlestick Structure study specifically describes sixteen candlestick formations, including the six discussed here. Its major-trend methods include Supertrend, EMAs, ChoCh and Donchian Channel; its minor-trend setting uses a Donchian length. The alignment dashboard measures how often formations align with the trend, not their trading win rate or a calibrated confidence score. Verify the chosen platform implementation and settings.
Write and Test the Complete Strategy
Ask Quant, our coding agent to implement the full specification: “Use a completed daily trend filter, detect a numerically defined bullish engulfing pattern after a local decline, wait for the stated trigger, and model next-eligible-price entry, expiration, position size, costs, stops and partial exits. Expose all thresholds.” Inspect generated code and run the strategy manually.
Review individual signals and fills, then evaluate trade count, net gains and losses, drawdown and exposure. Keep a later sample outside parameter selection and log every tested variant. A coding agent can implement a definition; it does not establish future profitability or automatically validate the data and execution assumptions.
Treat Alerts as Notifications
Configure only conditions supported by the selected tool and verify whether they fire during a candle or after its close. Test a sample alert against the chart timestamp.
Email, push or webhook delivery does not itself execute a trade. Any downstream execution arrangement needs its own configuration and checks for duplicates, delay and failed orders. There is no general evidence here that enabling an alert automatically improves timing or returns.
Keep a Consistent Pullback Record
| Stage | Record | Question |
|---|---|---|
| Context | Trend definition, anchors and completed timeframe values | Was the setup actually inside the stated trend? |
| Pattern | OHLC values, geometry and completion time | Did the exact named rule qualify? |
| Execution | Entry type, waiting limit, fill and costs | Was this fill available under the chosen order rule? |
| Risk | Quantity, planned stop, targets and actual exit | How did realized risk differ from the plan? |
| Review | All candidates, missed trades and parameter versions | Does the idea survive beyond selected winners? |
The goal is a repeatable decision process: define context, recognize a completed pattern, apply a chosen entry method and measure the actual result. Preserve losing and expired setups in the journal so that a neat chart does not substitute for a complete evaluation.
Frequently Asked Questions
Does a pullback pattern guarantee that the trend will resume?
No. It describes a possible reversal of the local countertrend move. The broader trend and entry rules must be defined separately, and the trade can still fail.
Must an engulfing candle cover the entire previous candle?
No. Classical engulfing compares real bodies, from open to close. It does not require the second candle’s high-to-low range to contain the first. Specify how equal body boundaries are handled.
Can I use a daily pattern to enter earlier in the same day?
Not using the final daily values before they are known. A completed daily pattern is available only after that candle closes. An intraday condition is a different rule and should be tested as such.
Is a 61.8% retracement a guaranteed reversal level?
No. It is a price reference derived from chosen swing anchors. Combining it with a pattern adds a condition whose value must be tested. The commonly displayed 50% midpoint is not itself a Fibonacci ratio.
Does Candlestick Structure’s alignment percentage mean win rate?
No. Its documented dashboard reports pattern alignment with the selected trend. A trading win rate requires complete entry, exit, execution and cost rules and a defined evaluation sample.
How should I test a pullback strategy in LuxAlgo?
Inspect the inputs in native LuxAlgo charts and ask Quant, our coding agent, to express explicit trend, pattern, timing, entry, exit, risk and cost rules. Inspect generated code, run the strategy manually and verify individual trades before interpreting summary results.
Read next