Concept
Dragonfly Doji
Dragonfly Doji is a Chart & Candlestick Patterns concept. The Library holds 1 implementation, a working definition you can pull into Quant.
Top Dragonfly Doji indicator
The top custom implementation, built on the original standard Dragonfly Doji formula.
1 total
From studying Dragonfly Doji to trading it: take the implementation below into Quant and backtest it instantly.
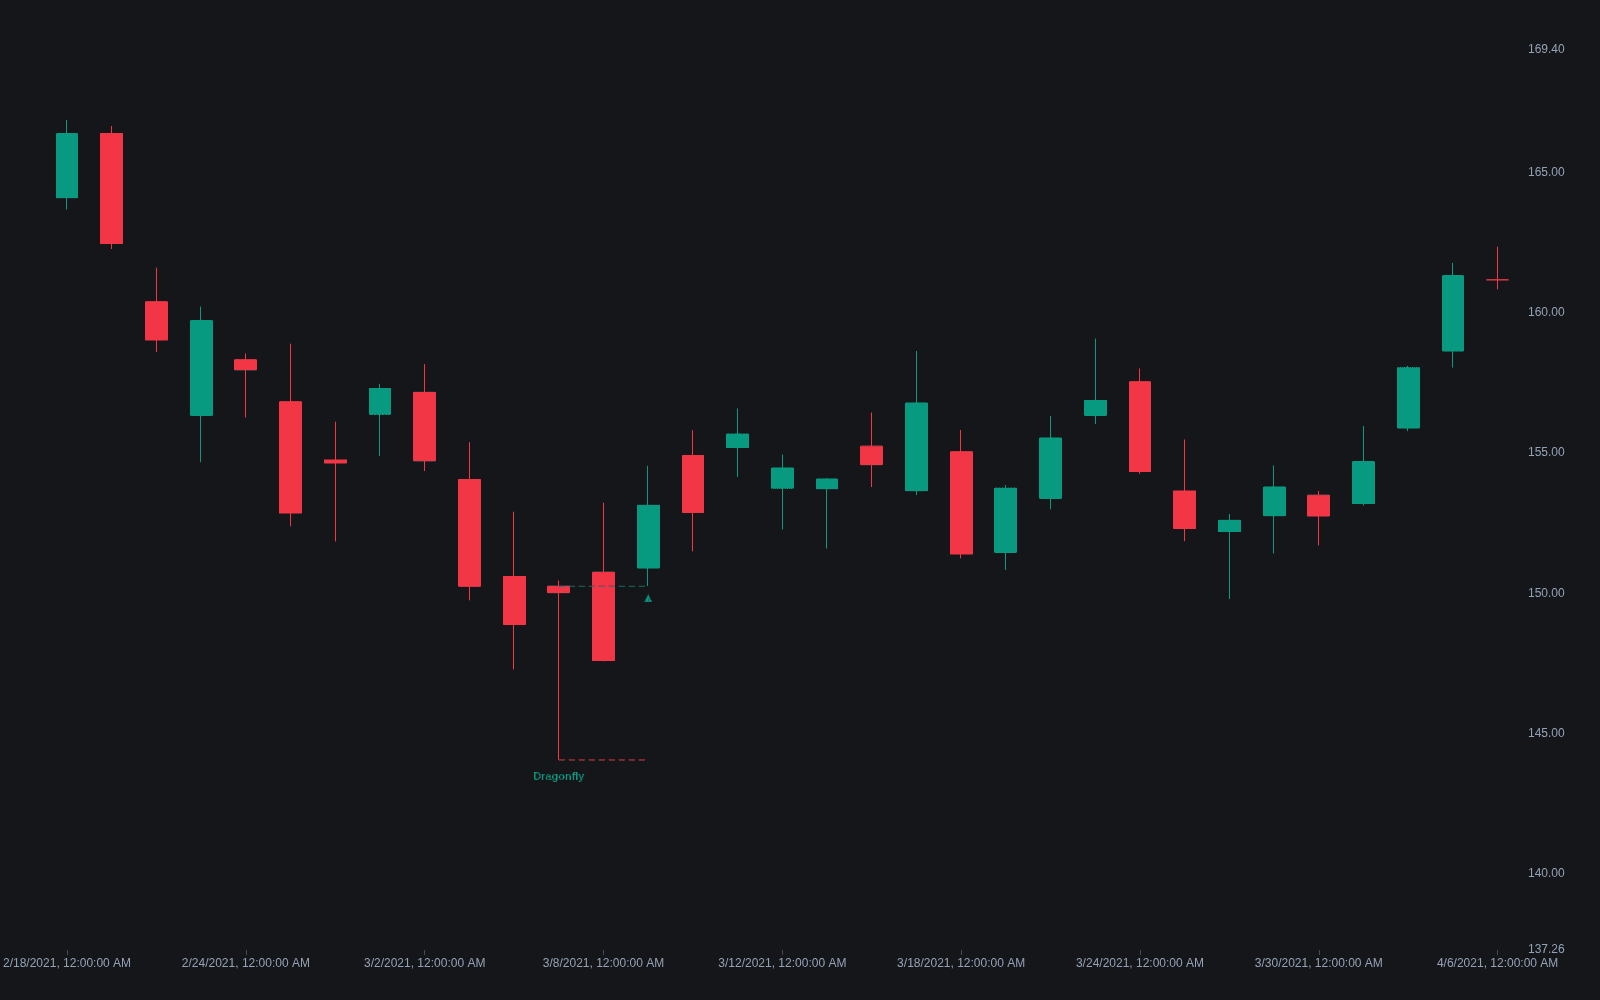
What is a dragonfly doji?
The dragonfly doji is a single candle shaped like a capital T: open, close, and high all sit at or very near the same price at the top of the range, with a long lower shadow beneath. It is the doji variant in which the entire session's trading happened below the open, was rejected, and returned, so the candle records a full round trip to lower prices that ended where it began.
The information is in the failed excursion. During the session, sellers drove price substantially lower; by the close, buyers had recovered every tick of the decline. After a downtrend, that reads as a demand response at lower prices and is watched as a potential bottoming signal. After an advance, some treatments read a dragonfly as a warning of the probing, indecisive trade that can precede a top, though the bullish-reversal reading at lows is the common one.
Like all doji, the dragonfly says more about the failure of one side than about the intentions of the other. A long lower shadow shows sellers lost the session, not that buyers will win the next one, which is why practitioners across the candlestick catalog treat it as an alert requiring confirmation rather than an entry in itself.
How to identify a dragonfly doji on a chart
The shape is distinctive, but the qualifying checks matter.
- 1Require open and close to be equal or nearly equal, placed at or very near the high of the bar, so there is no meaningful body and little or no upper shadow.
- 2Require a long lower shadow, commonly at least two to three times any body height, and long relative to recent bars.
- 3Weigh context: after a decline into support, the candle reads as rejection of lower prices; in the middle of a range it is mostly noise.
- 4Prefer sessions with elevated volume on the recovery, which supports the demand-response reading.
- 5Wait for confirmation, typically a following close above the dragonfly's body, before treating it as a reversal signal.
How traders use it
- As a bottoming alert: a dragonfly printing at prior support or after an extended decline flags active demand below the market, prompting traders to watch for a confirming up-close before entering.
- For risk definition: the low of the shadow is the natural stop location, since trade back below it means the rejected prices have been accepted after all.
- As an exit or tightening cue for shorts: sellers holding positions into a dragonfly at support often reduce or tighten, because the candle documents absorption of their pressure.
- With honest limits: the same shape prints routinely on low-volume sessions and inside ranges where it carries little information, and even in good locations a single candle reverses trend far less often than continuation resumes. Confirmation and location filters are not optional.
Dragonfly doji vs neighboring candles
Hammer: The hammer has a small but real body at the top of its range, while the dragonfly's open and close coincide. In practice they encode the same lower-shadow rejection, and many scanners treat the dragonfly as the limiting case of the hammer.
Gravestone doji: The gravestone is the mirror image: open and close at the low with a long upper shadow, recording a failed excursion higher rather than lower.
Doji: A standard doji has shadows on both sides with the tiny body near the middle, expressing balanced indecision; the dragonfly places the body at the extreme, expressing a one-sided rejection instead.
Concept family
Chart & Candlestick Patterns
84 concepts mapped · 84 in the Library
Dragonfly Doji FAQ
Turn Dragonfly Doji into a trading strategy.
Take the implementation from this page into Quant, then build on it, backtest it on real data, and keep refining it in conversation.