Concept
Single Prints
Single Prints are Volume & Order Flow concepts. The Library holds 1 implementation, a working definition you can pull into Quant.
Top Single Prints indicator
The top custom implementation, built on the original standard Single Prints formula.
1 total
From studying Single Prints to trading it: take the implementation below into Quant and backtest it instantly.
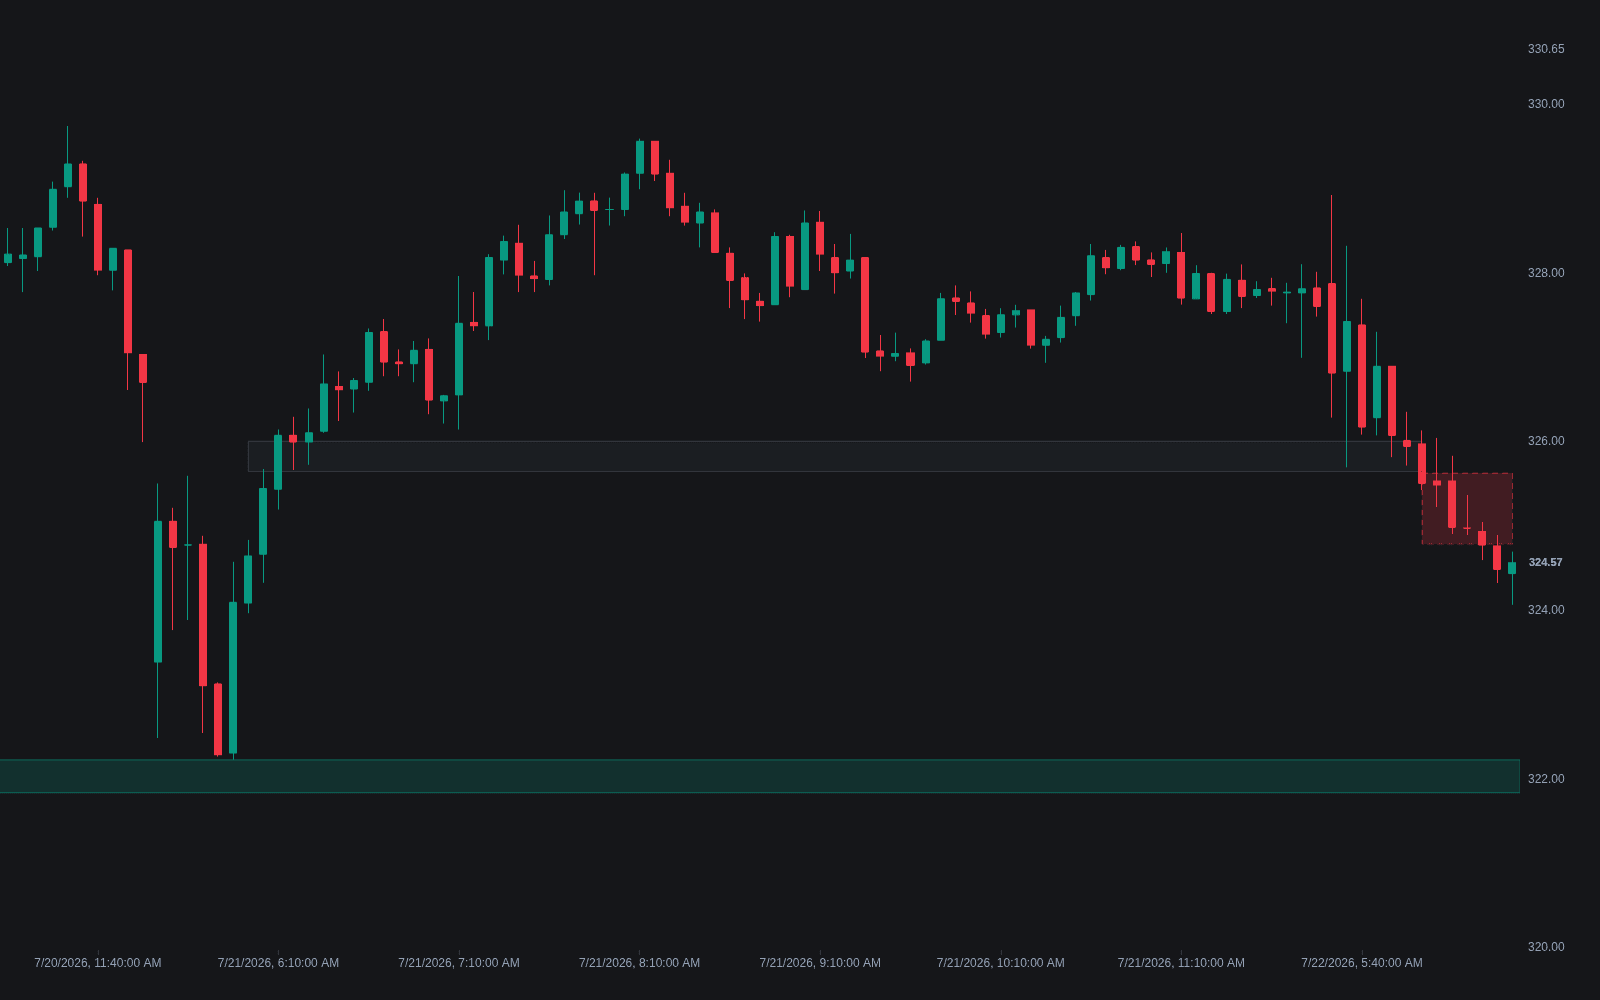
What are Single Prints?
Single prints are price levels in a TPO profile that traded during only one time bracket, leaving the profile exactly one letter wide there. When they sit inside the body of the profile rather than at its extremes, they record a fast, one-directional move: price transited those levels so quickly that no later period returned to trade them. Auction theory reads that thinness as initiative activity that left an unfinished, one-sided auction behind.
Convention matters here: single prints at the very ends of a session's profile are called buying or selling tails and signal rejection, so the term usually refers to the mid-profile kind. Traders treat them like other thin structures, close cousins of low-volume nodes and the price-action fair value gap: potential support or resistance while intact, and a candidate for repair when price returns to auction the area properly. Neither the hold nor the fill is guaranteed.
The mechanics come from how TPO charts are built. Each half-hour bracket of the session gets a letter, and every price the market touches during that bracket collects that letter; a row with exactly one letter is a price the market visited during exactly one half hour of the day. Mid-session, that status is provisional, since any later bracket can rotate back and thicken the row; only the closing bell freezes the day's singles. The vocabulary belongs to the Market Profile tradition of Steidlmayer and Dalton, where singles sit alongside related unfinished structures: poor highs and lows, extremes that end flat and untapered, carry a similar incomplete-auction message from a different shape.
Practical treatment is bookkeeping plus patience. The single-print range is marked by its edges, because a return to the zone tends to be judged there first, and it stays on the map until repaired, meaning a later session rotates through and auctions the area properly, at which point the level retires. Trackers like benb1122's TPO Levels study automate the ledger, carrying singles forward beside value areas, poor extremes and naked POCs. The honest framing matches the rest of the profile toolkit: these are well-defined reference zones with auction logic behind them, not statistical guarantees, and recent singles from the current volatility regime deserve more attention than relics.
How to identify single prints
The definition is mechanical, so identification is mostly about location and timing.
- 1Build the session's TPO profile with standard half-hour brackets, each contributing its letter to every price it touched.
- 2Find rows exactly one TPO wide: prices the market visited during only a single bracket of the session.
- 3Classify by location: singles at the profile's extreme top or bottom are tails, rejection structures; singles inside the body are the fast-transit kind the term usually means.
- 4Wait for the close before trusting the label, since any later bracket can rotate back and thicken a provisional single into ordinary structure.
- 5Mark the single-print range by its edges and carry it forward; the first return to those edges is where the repair-or-reject question gets answered.
How traders use it
- As reference levels: the edges of a single-print range are common spots to watch for a reaction on first retest, on the logic that a move fast enough to leave singles may be defended where it started.
- As unfinished business: when price rotates back, traders watch whether the thin zone fills in period by period (repair, which retires the level) or gets rejected quickly (the original imbalance is still being defended).
- As a day-type tell: fresh single prints appearing mid-session mark initiative range extension and argue against fading the move, while their absence keeps the day in balanced, rotational territory.
- In value-map context: singles connecting two balance areas act as thin corridors, so acceptance back into the zone often travels quickly across it toward the far value area and its point of control.
- As part of an unfinished-business ledger: singles, poor highs and lows, and naked POCs tracked together give swing traders a running list of prices the auction still owes attention, with each item retired as the market repairs it.
Single prints vs related thin structures
TPO Profile: The profile is the lens, singles are one artifact seen through it: rows exactly one bracket wide. Without the TPO construction the concept does not exist, which is why volume-based charts need analogous but distinct vocabulary for their thin zones.
High/Low-volume Nodes: A low-volume node is thinness measured in contracts traded; a single print is thinness measured in time spent. The two usually coincide across a fast move but need not, and each catches cases the other misses: a brief but heavy stop-run prints singles without a volume hole.
Fair Value Gap: The FVG is candle arithmetic, a three-bar imbalance visible on any chart; singles are session-profile structures confirmed only at the close. Both mark one-sided delivery expected to be revisited, so they frequently nominate the same zones from different clocks.
Concept family
Volume & Order Flow
88 concepts mapped · 88 in the Library
Single Prints FAQ
Turn Single Prints into a trading strategy.
Take the implementation from this page into Quant, then build on it, backtest it on real data, and keep refining it in conversation.