Concept
Initial Balance
Initial Balance, also known as IB extension, is a Volume & Order Flow concept. The Library holds 2 implementations, each one a working definition you can pull into Quant.
Top Initial Balance indicators
The top custom implementations, built on the original standard Initial Balance formula.
2 total
From studying Initial Balance to trading it: take any implementation below into Quant and backtest it instantly.
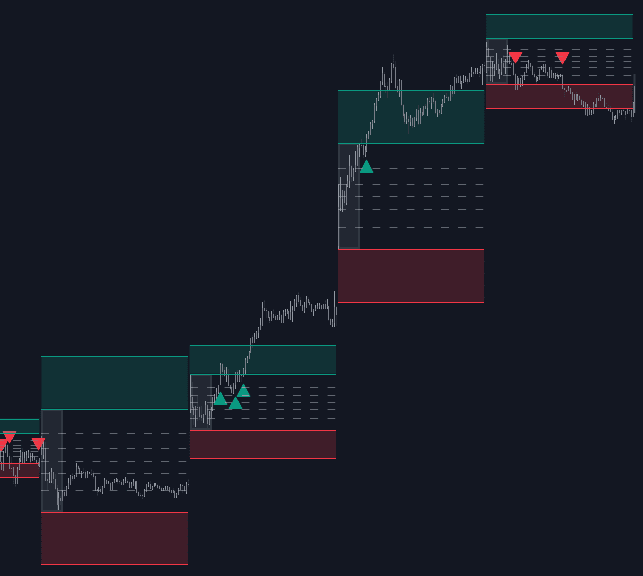
What is the Initial Balance?
In Market Profile, the initial balance is the price range established at the start of the regular session, classically the first hour of trade, meaning the first two 30-minute periods of a TPO profile. The concept comes from J. Peter Steidlmayer's original framework at the Chicago Board of Trade, where the opening hour's range marked the zone in which the earliest auction found two-sided trade. The IB high and IB low become the day's first reference levels.
Steidlmayer developed the profile framework at the CBOT in the early 1980s, and the exchange released it publicly in 1985. On the lettered charts the initial balance spans the session's first two half-hour brackets, the periods most modern TPO software labels A and B. James Dalton's Mind Over Markets (1990) carried the idea to a wider audience and made the IB central to day-type classification.
The IB frames day-type inference. When later trade extends well beyond it (range extension, often called an IB extension), other-timeframe participants are active and the session leans directional; when the IB contains most of the day, the market is balancing and rotational. The common reading is that a narrow IB is easier to extend and often precedes directional days while a wide IB tends to hold, but these are tendencies rather than rules and any given session can break them.
Electronic and near-24-hour markets blur the definition. Index futures trade overnight, so the IB is conventionally measured from the regular cash open rather than the overnight reopen; forex and crypto have no official session, so traders substitute conventions such as the London or New York opens, and the choice changes the levels. The range also gains meaning from its internal composition: where the early point of control forms inside the IB, and how volume stacks on a volume profile of the first hour, color whether the balance looks likely to hold.
How to mark the initial balance on a chart
The IB is mechanical to draw once the session convention is chosen.
- 1Fix the session open your market keys off: the cash open for equities and index futures, or your chosen session convention in 24-hour markets.
- 2Take the first 60 minutes of trade from that open, the session's first two 30-minute periods.
- 3Mark the hour's highest high and lowest low and extend both across the session as IB high and IB low.
- 4Optionally add the IB midpoint, which responsive traders watch for rotations.
- 5Track the session against the levels: extension beyond one side, both sides, or containment is the raw material of day-type reads.
How it's calculated
The Initial Balance is the price range built during the opening portion of a session, frozen and projected forward as reference levels for the rest of that session.
The 60-minute default comes from Market Profile's first two 30-minute TPO periods; a 30-minute IB is a common intraday variant.
On 24-hour markets the levels depend entirely on the session anchor chosen (exchange open, midnight, or an equity session).
Rough day-type guide: a normal day barely extends beyond the IB, normal variation roughly doubles it, and trend days keep extending; exact thresholds vary by author.
How traders use it
- For day-type classification: the width of the IB and whether price extends beyond one or both sides feeds the classic profile day types, from balanced rotational days to trend days, often read alongside open types.
- As breakout references: trades are keyed off breaks of the IB high or low, with continuation trusted more when the extension holds and stays one-sided; failed extensions that fall back inside the range are faded by responsive traders.
- For projections: some playbooks project multiples of the IB range, such as 1.5x or 2x, above and below it as mechanical extension targets for the session.
- For volume confirmation at the edges: a break of the IB high or low is trusted more when volume at breakout expands and volume delta stays one-sided through the level, and doubted on fading participation.
- As confluence with other session anchors: the IB midpoint, session VWAP, and the developing value area often sit close together in balanced conditions, and alignment between them sharpens fade and breakout reads.
- For sizing expectations: comparing today's IB width and relative volume against recent sessions frames whether the day has the participation to extend.
Initial balance vs related concepts
TPO Profile: The parent framework. A TPO profile organizes the session into half-hour letters; the initial balance is its first two letters read as a range. The profile keeps developing all day, while the IB freezes after the first hour and becomes the yardstick the rest is measured against.
Value Area: Both are profile-derived ranges, built differently. The IB is a time slice: everything traded in the first hour. The value area is an acceptance slice: the band holding roughly 70% of the day's activity wherever it occurred. By the close of a trend day much of the value area can sit beyond the IB.
Session VWAP: Two session anchors with different logic. VWAP is a continuously updating volume-weighted average trailing the whole session; the IB is a static bracket set by the first hour. Acceptance beyond the IB extreme on the far side of VWAP reads as a stronger statement than either alone.
Concept family
Volume & Order Flow
88 concepts mapped · 88 in the Library
Initial Balance FAQ
Turn Initial Balance into a trading strategy.
Take any implementation from this page into Quant, then build on it, backtest it on real data, and keep refining it in conversation.