Top 5 Price Momentum Indicators Compared
RSI, MACD, ADX, CCI, and the Stochastic Oscillator answer different questions about price behavior. RSI compares recent gains and losses, MACD compares moving averages, CCI measures departure from a recent average, and Stochastic locates the close within a recent range. ADX is different: it measures trend strength, not direction.
Choose an indicator around the question you want to investigate, then define and test the trading rule separately. In Quant Charts, LuxAlgo’s native charting platform, you can study indicators on the chart and use Quant to help code a reproducible comparison. No indicator or combination guarantees profitable entries.
Quick Comparison: Five Price Momentum Indicators
| Indicator | What it measures | Common starting settings | Main limitation |
|---|---|---|---|
| RSI | Smoothed gains relative to smoothed losses | 14 periods; 70/30 reference levels | An extreme reading can persist during a trend. |
| MACD | Difference between fast and slow EMAs | 12/26 EMAs; 9-period signal EMA | Lag and repeated crossings in sideways conditions; values use price units. |
| ADX | Strength of directional movement, regardless of direction | 14 periods; 20/25 reference levels | ADX alone cannot distinguish an uptrend from a downtrend. |
| CCI | Typical price relative to its average and mean deviation | 20 periods; +100/−100 reference levels | Unbounded; an extreme can signal continuation as well as reversal. |
| Stochastic | Close within the recent high-low range | 14-period range; 3-period smoothing choices | Persistent extremes and differences between fast, slow, and full versions. |
These settings are conventions to start an experiment, not settings proven best for every market or timeframe. Shorter lookbacks generally respond to more recent changes, while longer lookbacks smooth more history. The trade-off must be measured using the exact implementation, data, costs, and rules.
1. Relative Strength Index (RSI)
RSI is a bounded oscillator developed by J. Welles Wilder. For a conventional 14-period RSI, separate each close-to-close change into a gain or loss, then smooth the gains and losses using Wilder’s method. After initialization, its smoothing factor is 1/14, which differs from a standard 14-period EMA’s 2/15.
RS = smoothed average gain ÷ smoothed average loss
RSI = 100 − 100 ÷ (1 + RS). For example, average gains of 2 and average losses of 1 give RS = 2 and RSI ≈ 66.67. Zero-loss or entirely flat sequences require the implementation’s defined handling.
The conventional 70 and 30 levels label relatively strong and weak recent momentum. They are often called overbought and oversold, but are not probabilities of reversal. RSI can remain above 70 while price rises or below 30 while price falls. A reading above 50 means smoothed gains exceed smoothed losses; that is different from an extreme-threshold rule.
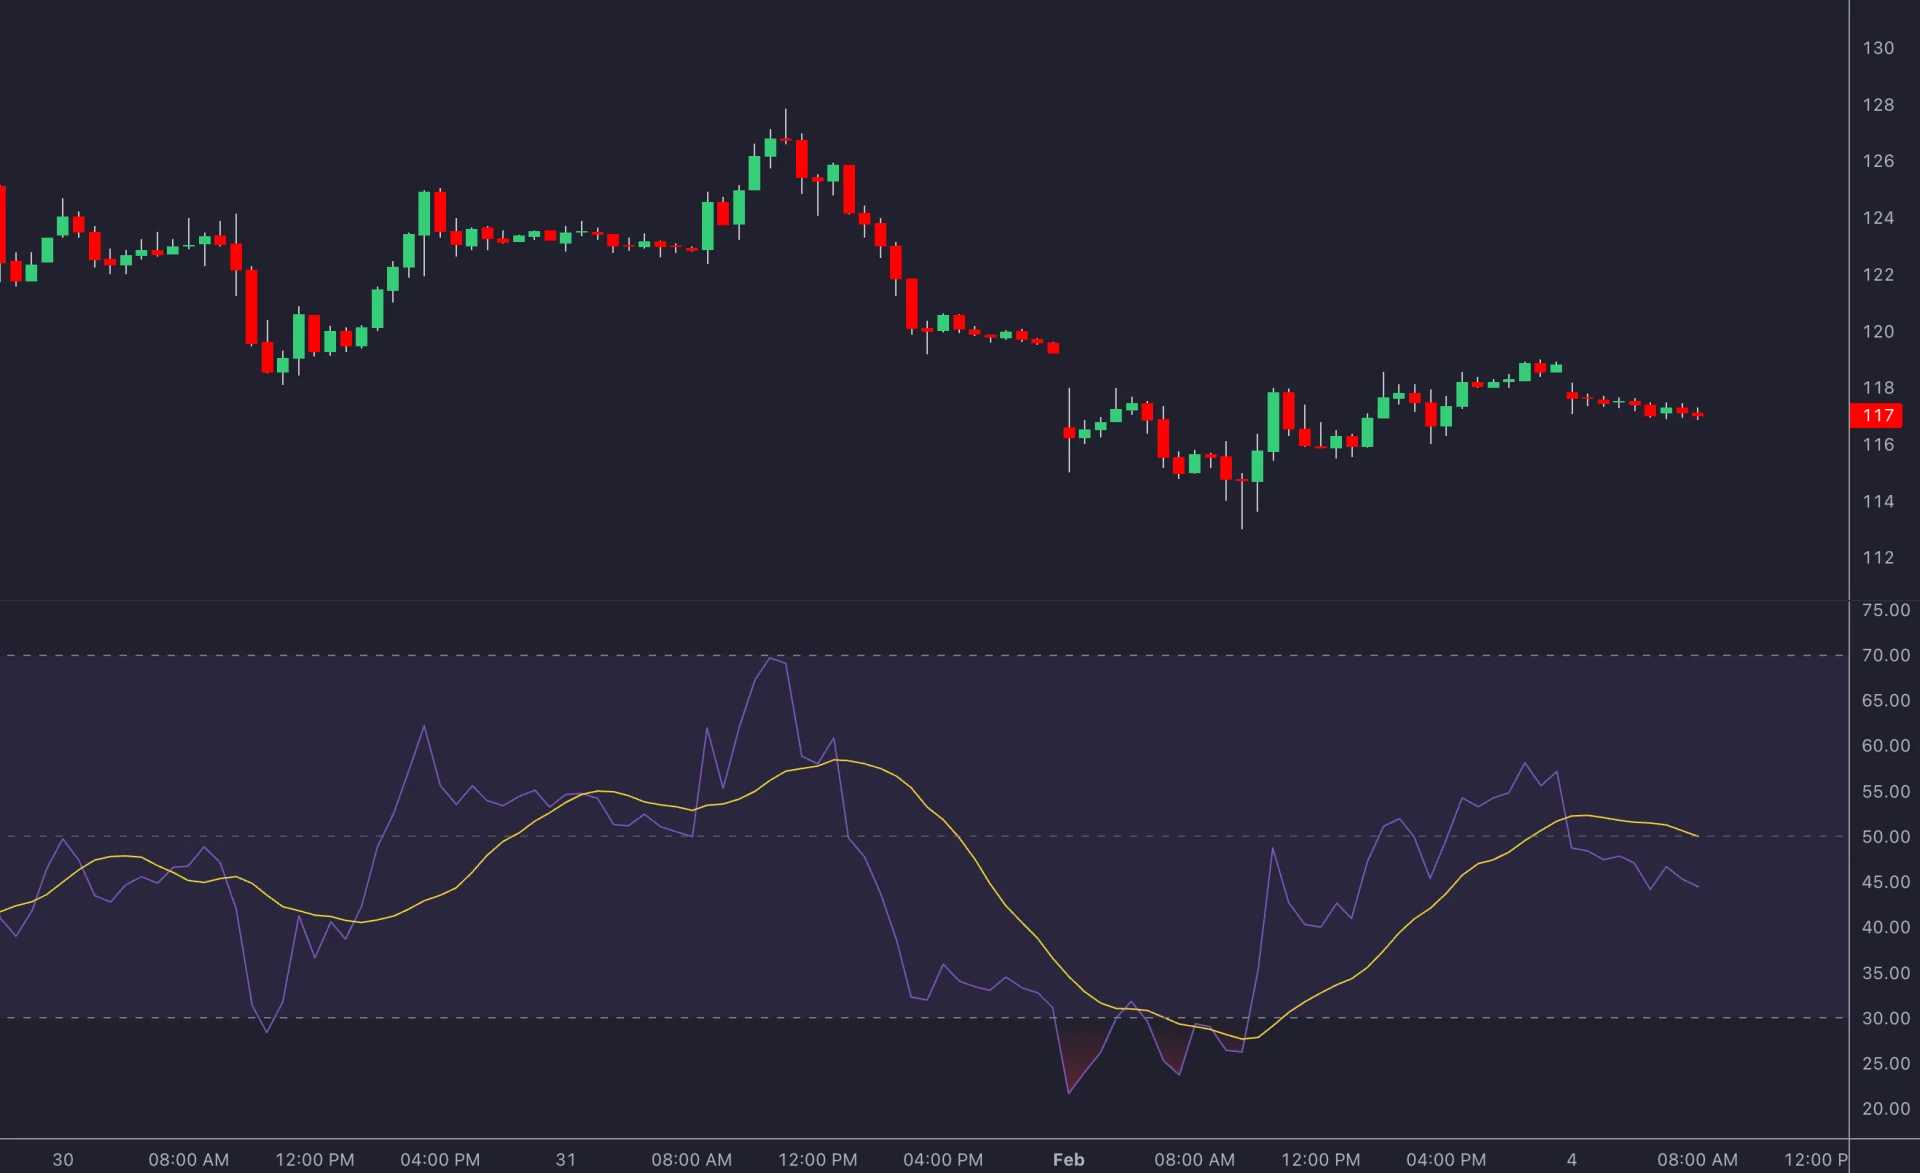
RSI Signals and Settings to Test
- Threshold recovery: distinguish entering oversold territory from crossing back above 30. The two events occur at different times.
- Divergence: compare defined price and RSI pivots. If a pivot requires later bars for confirmation, the signal becomes available later, not at the earlier plotted pivot.
- RSI failure-swing setup: one bullish definition has RSI below 30, a rebound, a pullback that stays above 30, then a break above the prior RSI rebound high. Specify each turning-point rule before testing.
- Alternative settings: 9–11 or 20–25 periods and 80/20 thresholds are research choices. They do not carry a universal accuracy advantage for short-term or longer-term trading.
The LuxAlgo RSI guide provides the core calculation and interpretation. Use RSI to express a precise momentum condition, then separately specify the entry, exit, holding period, and risk rule.
2. Moving Average Convergence Divergence (MACD)
Conventional MACD uses MACD = EMA(12) − EMA(26), a 9-period EMA of MACD as the signal line, and MACD − signal as the histogram. The input is commonly closing price; changing the source or smoothing changes the study.
If the fast EMA is 105 and the slow EMA is 103, MACD is 2. If its signal line is 1.5, the histogram is 0.5. A positive histogram means MACD is above its signal line, even if both lines happen to be below zero. A MACD zero crossing instead means the fast and slow price EMAs cross.
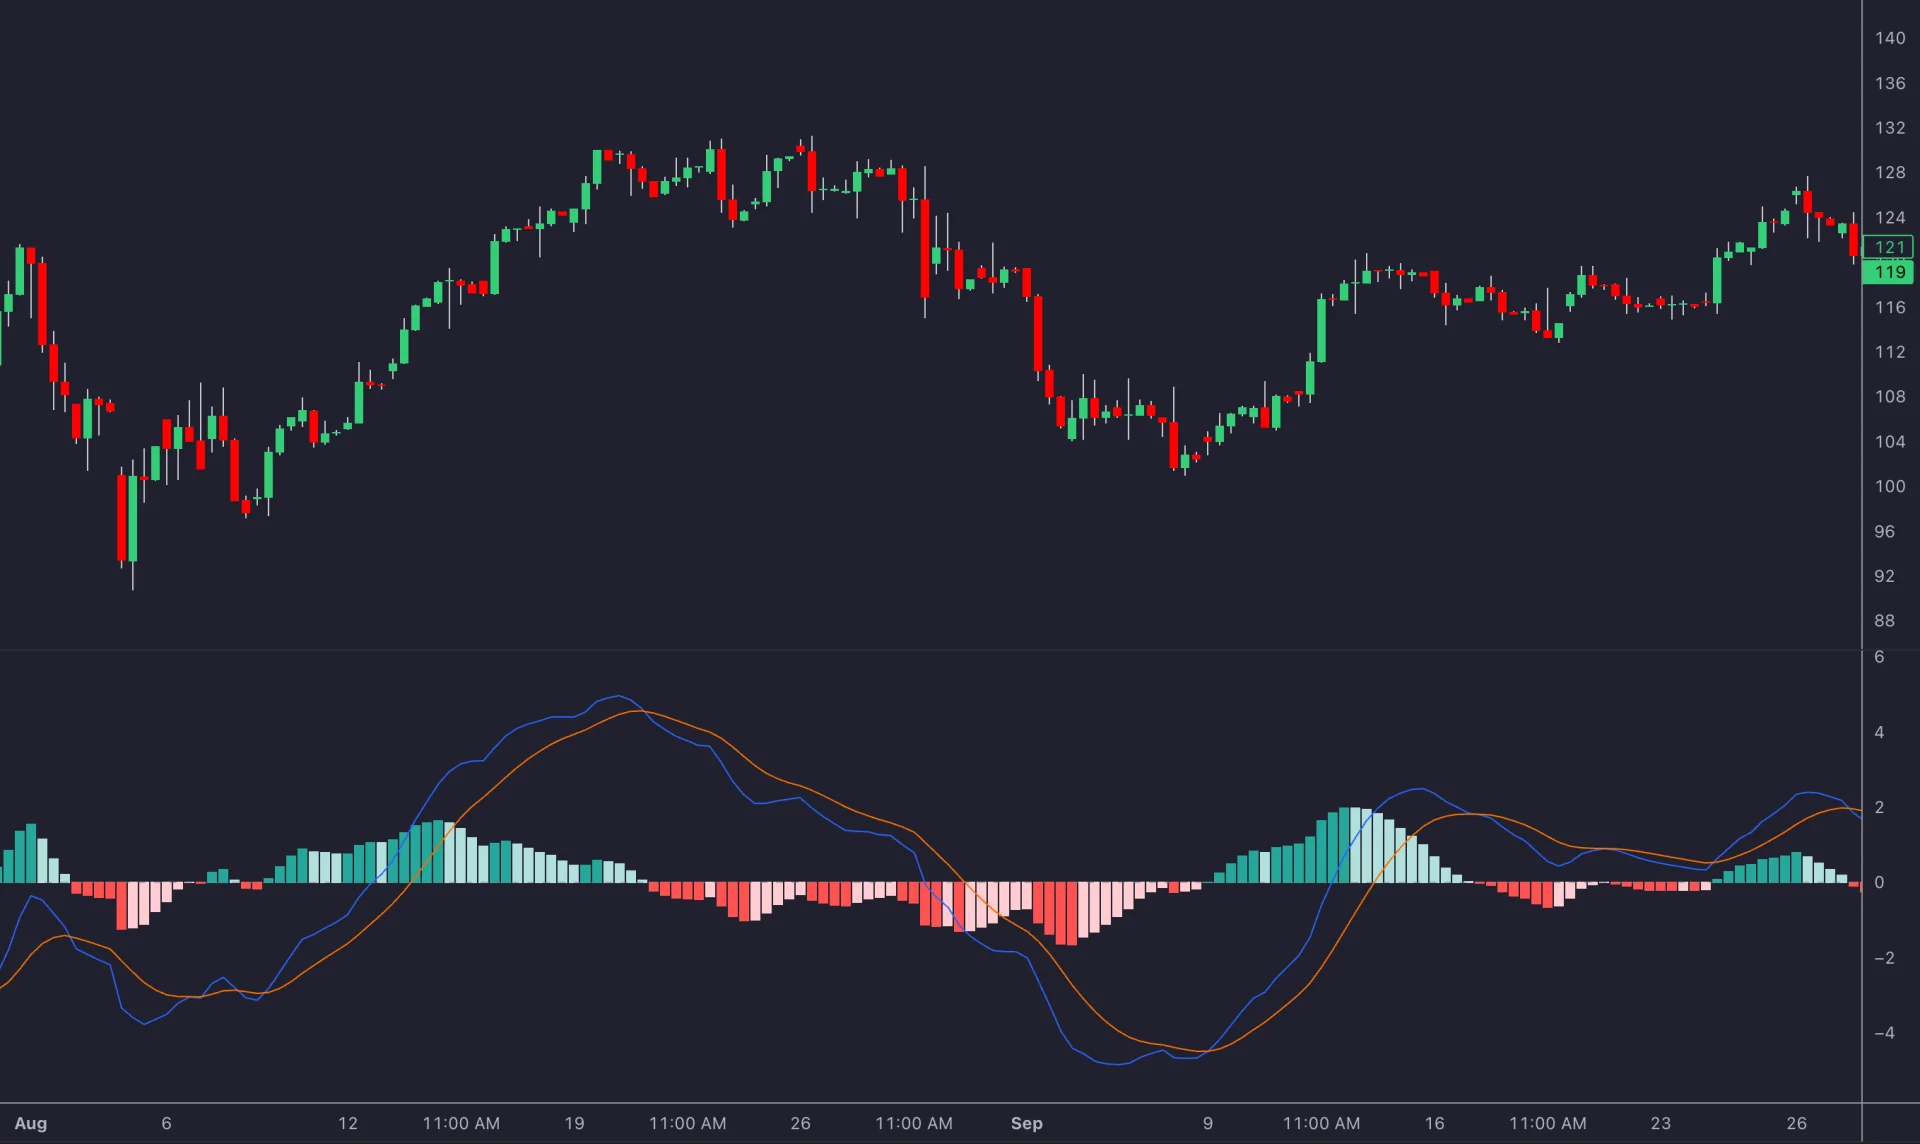
Signal-line crossings can describe a change in relative momentum; zero-line position adds trend context. Histogram contraction means the gap between the two lines is shrinking, not necessarily that price is about to reverse. MACD divergence also needs explicit pivot and recognition rules.
MACD is unbounded and expressed in the instrument’s price units, so a value of 2 is not directly comparable across differently priced assets. Moving-average lag can delay entries, and a sideways market can produce repeated crossings. A faster combination such as 5/13/8 changes responsiveness but is not inherently the best intraday setting.
Combine MACD with a defined context only if the additional rule improves a controlled test. ADX can supply trend-strength context, but it is not a volatility measurement. An isolated historical cryptocurrency rally does not establish that MACD captured its full return or predicts the next one.
3. Average Directional Index (ADX)
ADX belongs to Wilder’s Directional Movement system. Positive and negative directional movement are derived from consecutive highs and lows, smoothed, and normalized by smoothed true range to form +DI and −DI. The Fidelity DMI reference explains the relationship between these directional components and ADX.
DX = 100 × |+DI − −DI| ÷ (+DI + −DI); ADX is a smoothed DX series. For +DI = 30 and −DI = 10, DX = 50. Swapping the two gives the same DX with the opposite directional balance. Neither example means ADX immediately becomes 50, because it includes smoothing history.
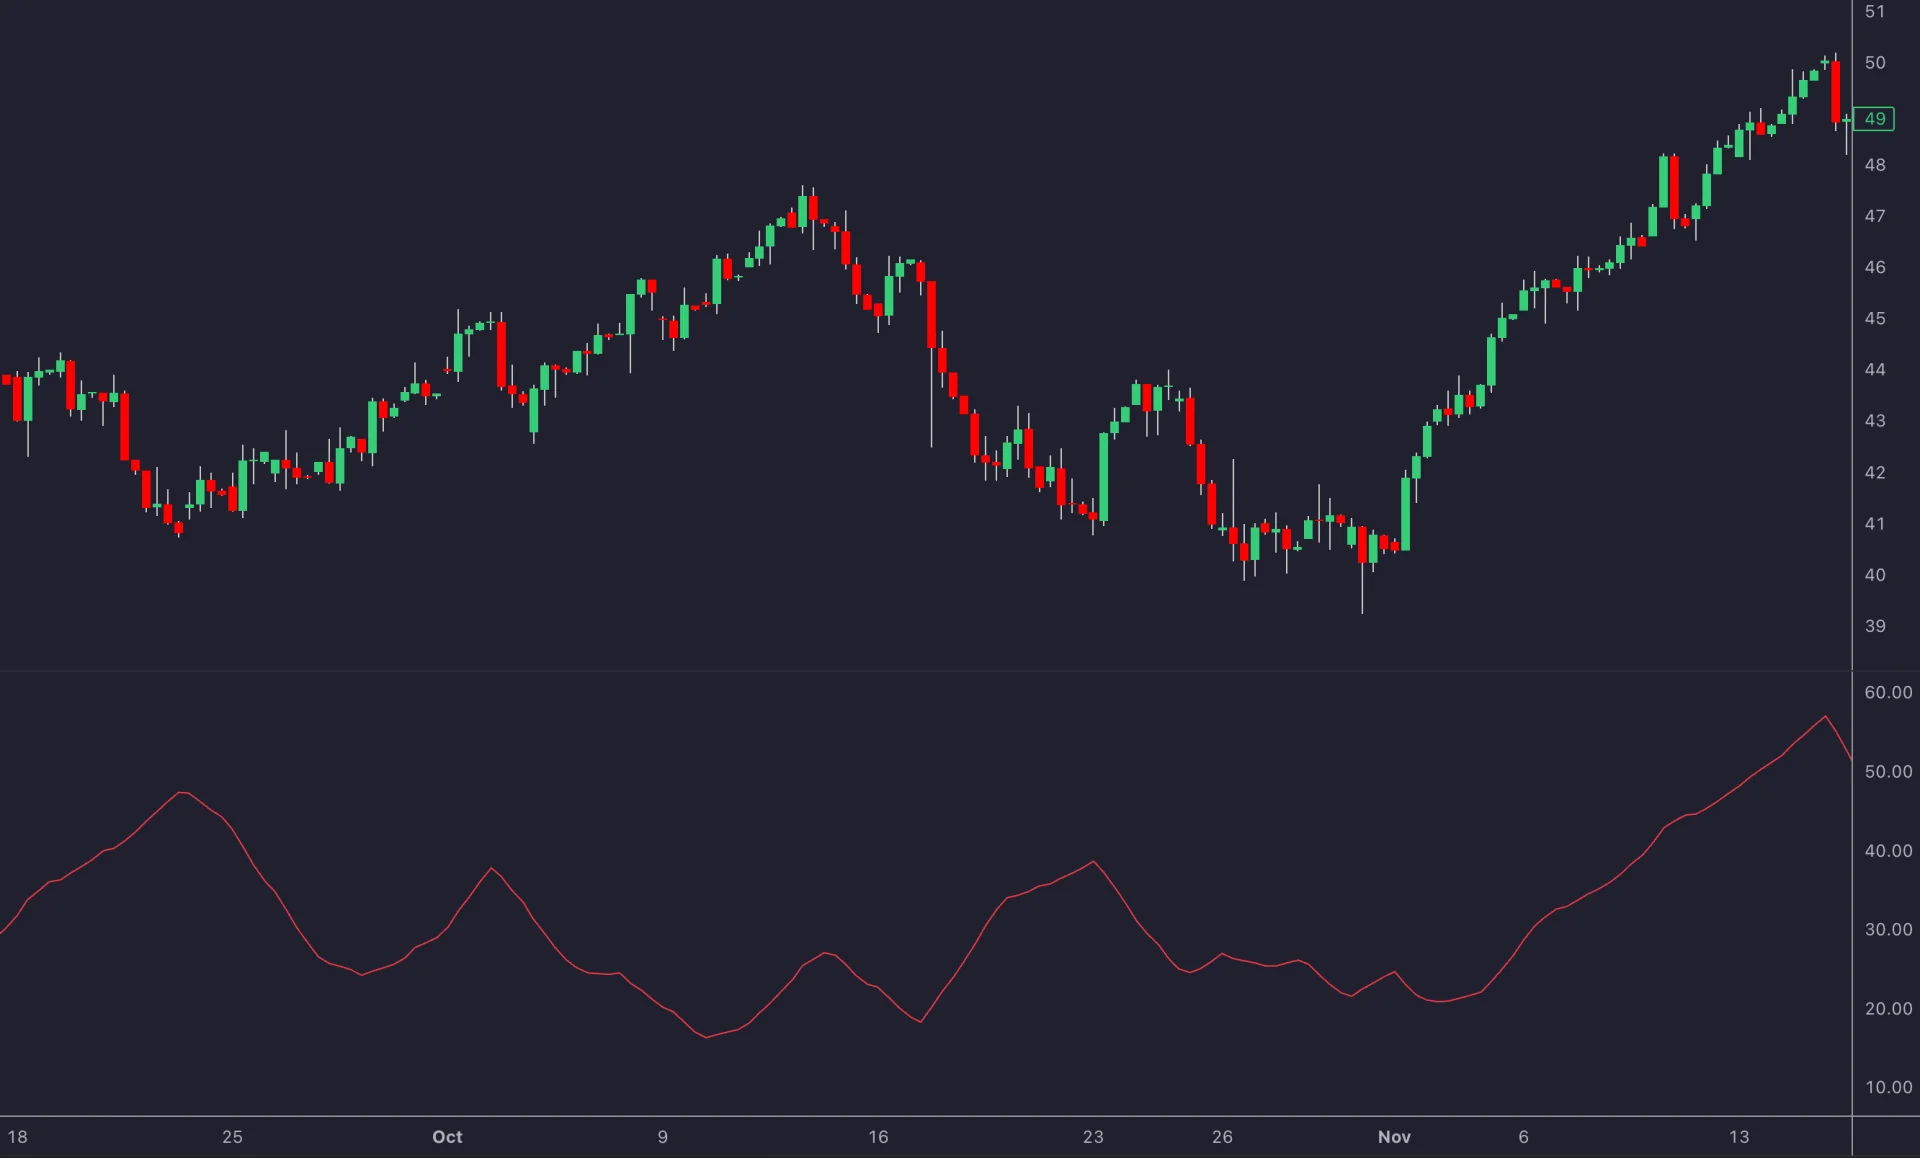
Read direction from the price structure or the +DI/−DI relationship. Rising ADX can accompany a strengthening downtrend as well as an uptrend. Falling ADX indicates weakening measured directional strength, not necessarily a price reversal.
| Reference | A possible interpretation | What it does not establish |
|---|---|---|
| Below 20 | Relatively weak directional strength under a common convention | A mandatory exit or proof that price cannot trend. |
| 20–25 | A transition area to evaluate within the chosen method | A sharp universal division between range and trend. |
| Above 25 | Stronger directional movement under a common convention | The direction, a guaranteed continuation, or a safe entry. |
| Very high readings | Strong recent directional movement | An automatic profit target or reversal at 50 or 75. |
A 14-period ADX is a common starting point. Test an ADX filter against the same strategy without it, because waiting for strength can exclude early moves and enter later ones. A rule requiring rising ADX differs from a rule requiring ADX above 25; avoid switching between them after seeing the results.
4. Commodity Channel Index (CCI)
CCI measures how far typical price is from its recent average relative to mean absolute deviation. Despite its name, it can be calculated on many instruments, not just commodities. A 20-period lookback is common, though implementations and strategies may use others.
Typical price (TP) = (high + low + close) ÷ 3
CCI = (TP − SMA(TP, n)) ÷ (0.015 × mean deviation). Mean deviation is the average absolute distance of the window’s typical prices from that window’s current SMA. It is not standard deviation.
For high 106, low 100, and close 103, TP is 103. If the 20-period average TP is 100 and mean deviation is 2, CCI = 3 ÷ 0.03 = 100. A zero-deviation window needs defined handling. The LuxAlgo CCI guide documents the calculation.
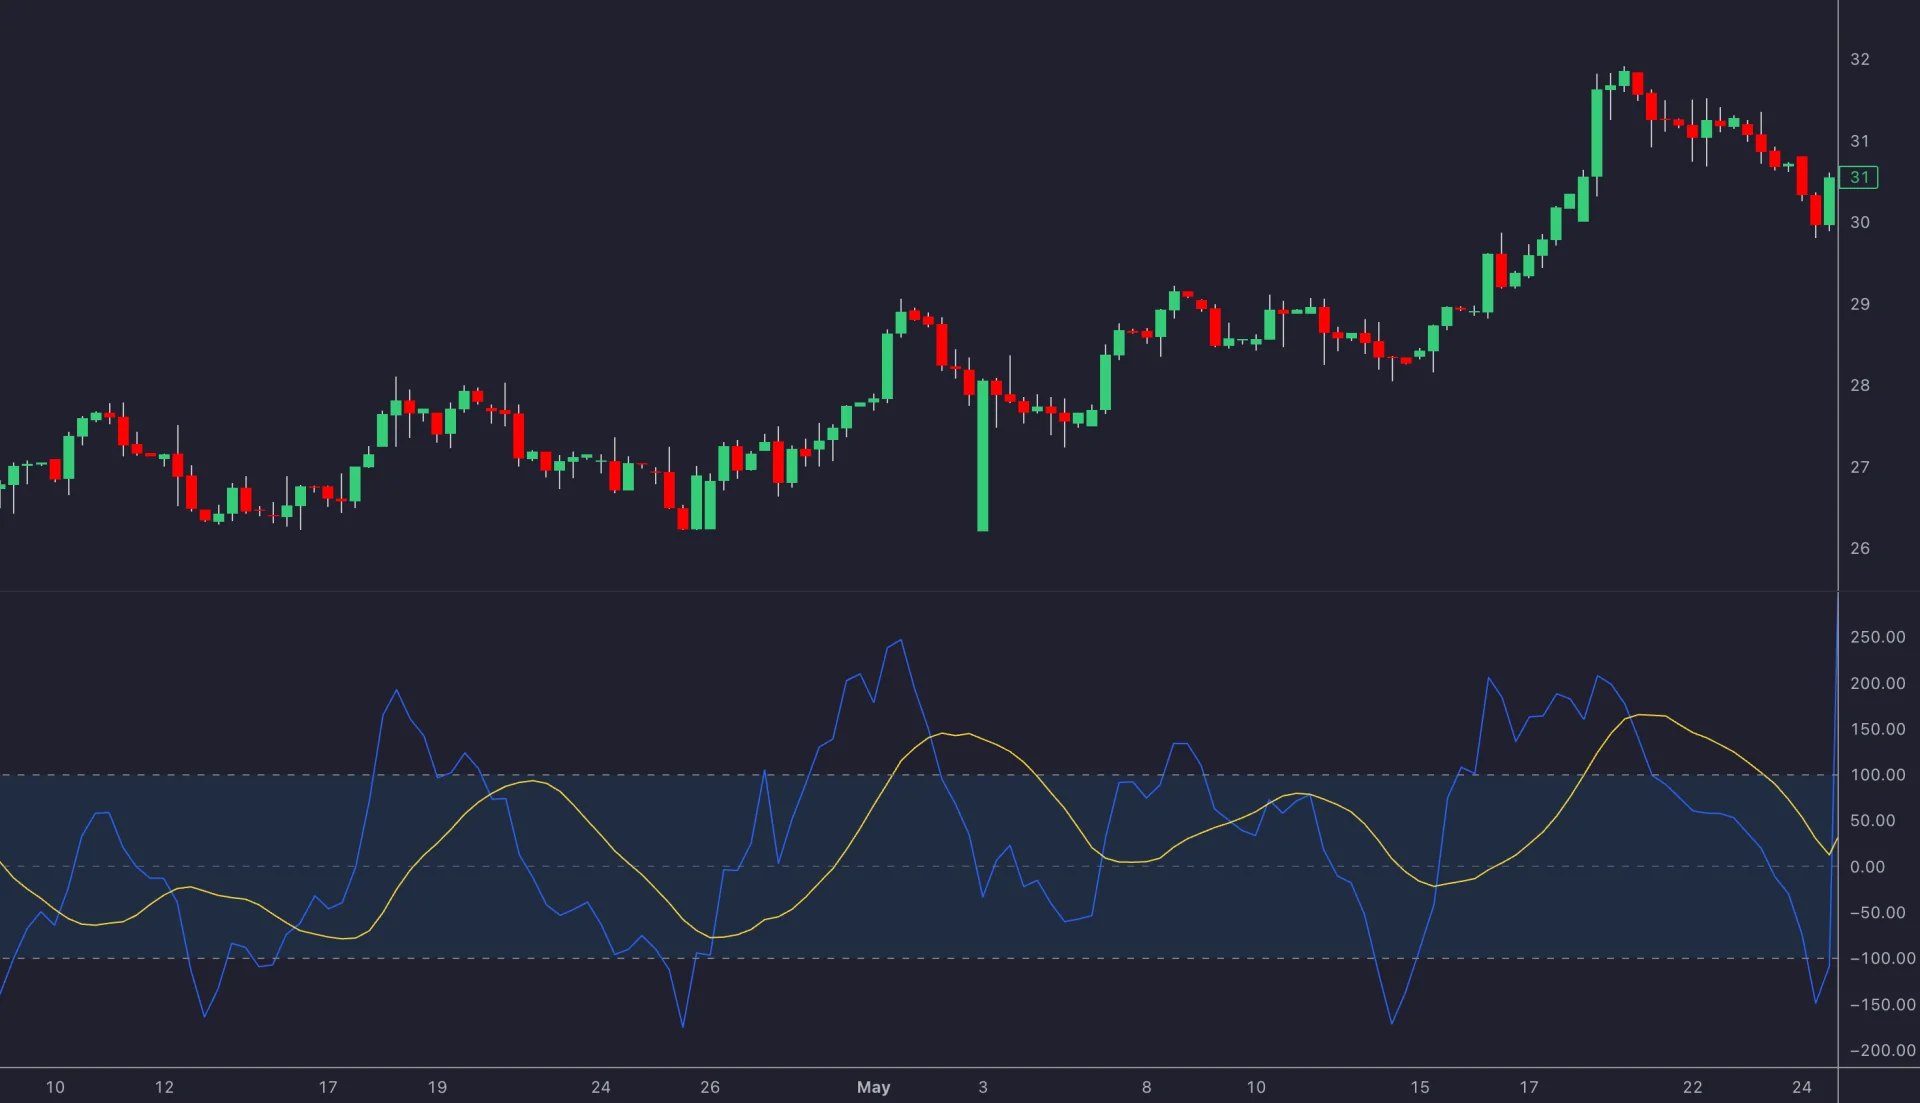
CCI is unbounded. A move above +100 can be used as a strength condition in a continuation strategy, while a return below +100 is a different event that a reversal strategy might study. Apply the same distinction below −100. Extreme values do not guarantee that price will return to its average.
Divergence and zero crossings provide other possible rules, but adding them creates a different strategy. CCI’s normalization does not make it a direct substitute for a volatility measure.
5. Stochastic Oscillator
The raw Stochastic Oscillator locates the latest close within a lookback range: %K = 100 × (close − lowest low) ÷ (highest high − lowest low). A close of 108 within a range from 100 to 110 produces %K = 80. With a nonzero range and an ordinary close inside that range, raw %K lies between 0 and 100.
In the fast version, %D commonly averages three %K values. Slow Stochastic adds smoothing to %K, while full Stochastic exposes the lookback and smoothing choices. A label such as 14/3/3 therefore needs the implementation’s definitions; it should not be treated as identical to raw 14-period %K. Flat ranges require a denominator guard.
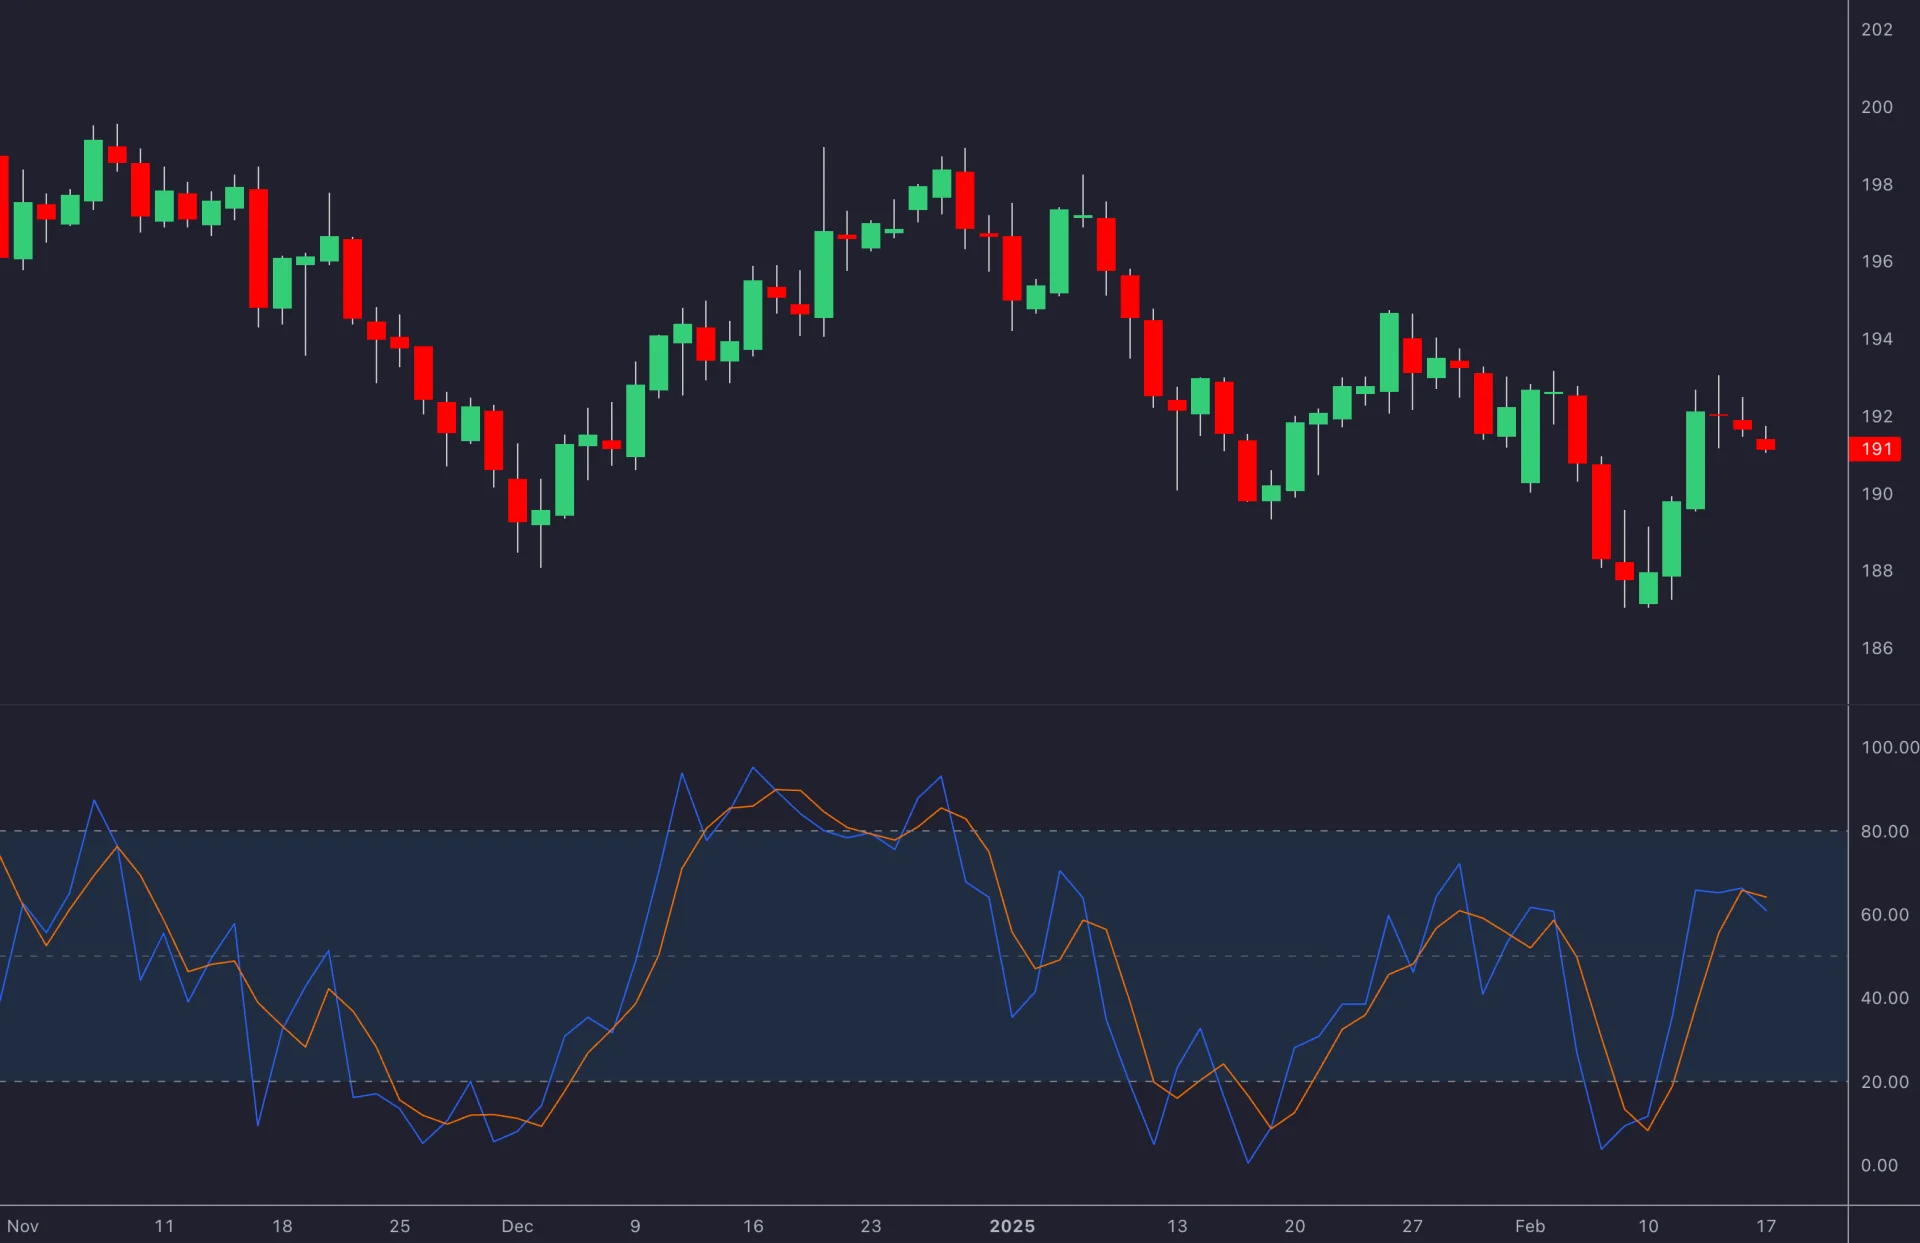
Readings above 80 or below 20 describe where the close sits in the recent range. Strong trends can keep it near one endpoint. A %K/%D crossing, a threshold recovery, and a price/oscillator divergence are distinct triggers with different timing; specify which one you mean.
Stochastic and RSI can disagree without either being broken: one measures range location and the other smoothed gains relative to losses. Combining them may select fewer trades, but agreement does not automatically improve accuracy. Price pivots used for divergence still need their later confirmation bars.
LuxAlgo Variants: What Changes in the Calculation?
LuxAlgo’s library includes variants that change how momentum is calculated or smoothed. Compare each with its standard counterpart on the same data. More settings or a different visual response is not proof of a better strategy.
Adaptive MACD
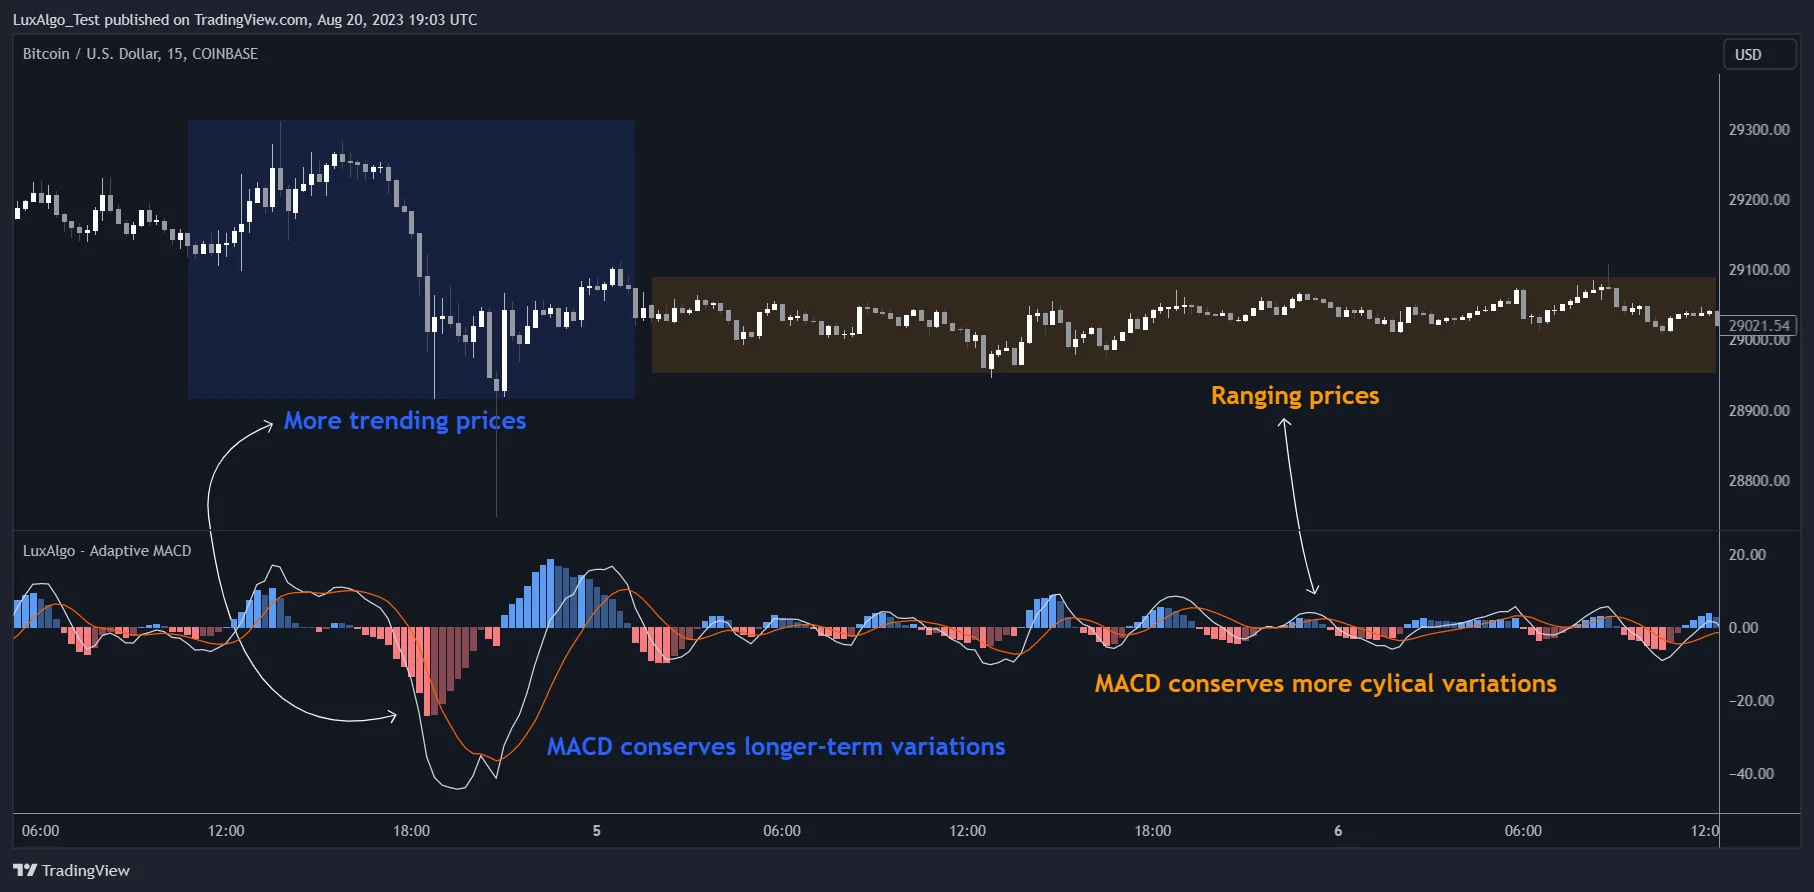
The Adaptive MACD library page describes a rolling R² measure that changes the filter’s weighting as price exhibits more linear or more cyclical behavior. Its controls include R² Period, Fast, Slow, and Signal. This differs from applying the conventional fixed EMA pair.
Inspect its current settings and code before interpreting a crossing as equivalent to standard MACD. Adaptation does not eliminate noise or guarantee earlier profitable signals. Compare the trade timing and outcomes, not only the visual smoothness.
Ultimate RSI
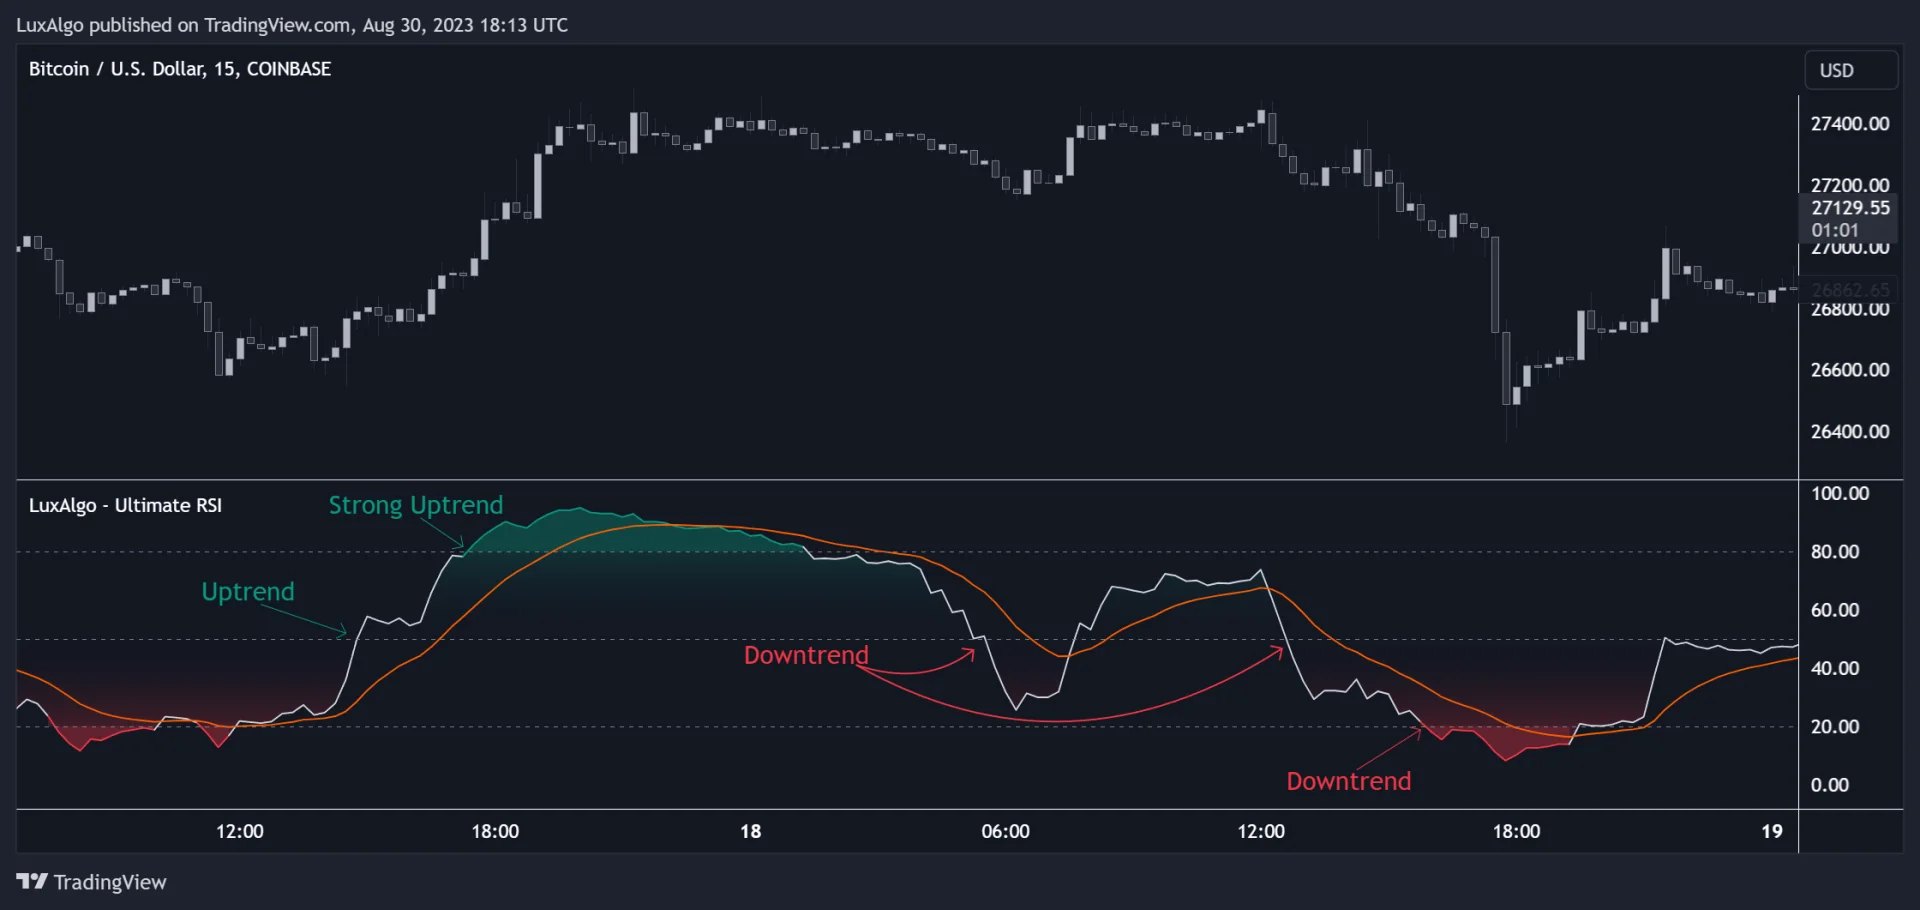
The Ultimate RSI library indicator modifies the input change when price makes a new high or low over its rolling range. Its configurable source, smoothing method, and separate signal line make it different from conventional Wilder RSI. Available smoothing choices include EMA, SMA, RMA, and TMA.
A trend-sensitive response can be useful to investigate, but do not transfer every standard RSI threshold rule without testing it. State the oscillator method and signal settings when comparing results.
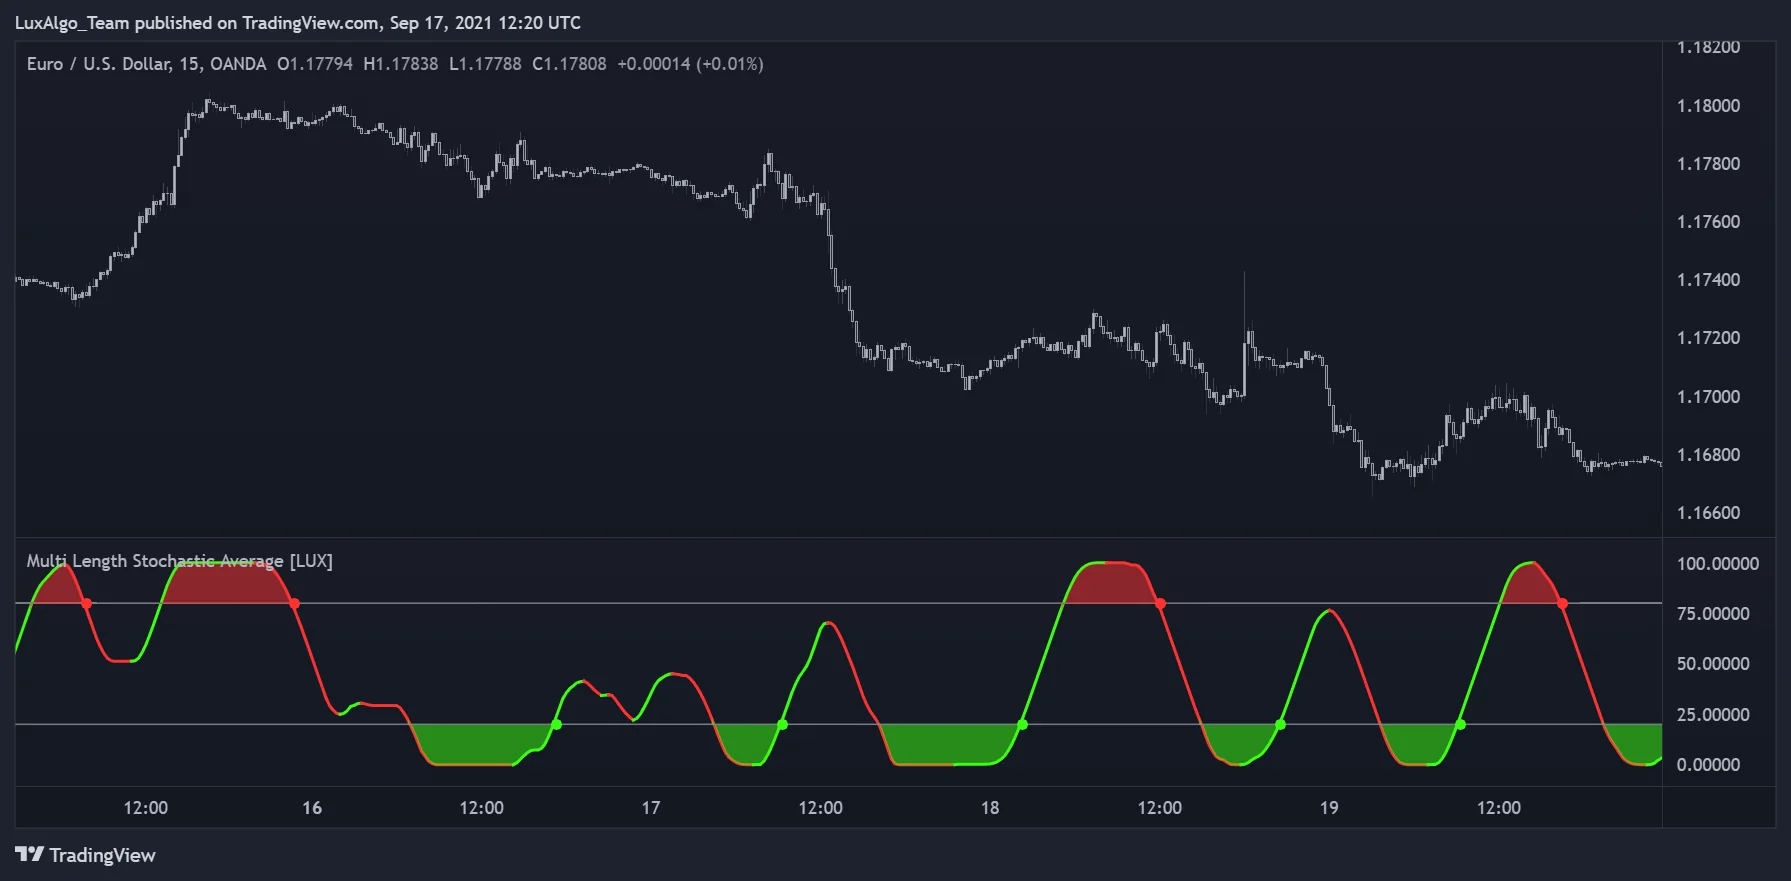
Multi-Length Stochastic Average
The Multi-Length Stochastic Average averages Stochastic calculations across lengths from 4 through the selected maximum. For a maximum of 6, values of 40, 60, and 80 for lengths 4, 5, and 6 average to 60. These are multiple lookbacks on the input series, not multiple chart timeframes.
The documented settings include source pre-smoothing and output smoothing, with choices such as SMA, TMA, LSMA, or None. The raw component oscillators are bounded for valid nonzero ranges, but a post-filter such as LSMA can overshoot; do not promise that every smoothing configuration remains strictly between 0 and 100.
Compare Momentum Indicators in Native LuxAlgo Charts
Start in Quant Charts and use the native indicator picker’s Basic and Library tabs to find the study you need. Inspect the active chart’s settings and save a useful arrangement as an indicator template. Keep the same symbol, data source, timeframe, and session when comparing alternatives.
Do not add every oscillator simply to create more agreement. RSI, MACD, CCI, and Stochastic reuse price information and can be correlated. ADX adds a different strength measure, but a filter still needs evidence. Position size should follow the specified risk model rather than the number of indicators pointing in the same direction.
A Reproducible Test with Quant
Ask Quant, our coding agent to implement one precise baseline and controlled alternatives. For example: enter long at the next bar’s open after a completed RSI(14) crosses back above 30, exit after ten completed bars, allow one position at a time, and use a specified fixed allocation. This is a research specification with no protective stop; its allocation is not a guaranteed maximum loss.
Then compare the same baseline with a completed-bar ADX(14) above 25 filter. Hold the data, period, costs, allocation, and exit rule constant. If you also change the exit and RSI threshold, you can no longer attribute the difference solely to ADX.
Inspect the generated code and run manually in the native strategy workflow. Check initialization, price source, crossing logic, order timing, and any pivot confirmation. Review individual trades against the chart, include trading costs, and evaluate a later period that did not guide the choices.
- Record net results, drawdown, exposure, trade count, and average win and loss; a higher win rate can still accompany a losing strategy.
- Check whether improvements persist across reasonable nearby settings and more than one market period.
- Account for missed fills, spread, slippage, and the chosen session. Use standard price candles when evaluating executable order assumptions.
- Keep the standard indicator as a baseline when evaluating an adaptive or smoothed variant.
For example, 60 wins of $10 and 40 losses of $20 produce −$200 before costs, despite a 60% win rate. Another $100 in costs makes the result −$300. Indicator agreement or attractive chart examples cannot replace this accounting.
Stochastic, RSI, and MACD: Video Example
This retained Data Trader tutorial demonstrates a combined-indicator strategy. The creator’s “Proven 100x” title and backtest claims are not independently verified performance evidence. Use the video to identify rules to inspect and reproduce, including losing trades and costs, rather than as a promise of profit.
Frequently Asked Questions
Which momentum indicator is best?
There is no universally best indicator. RSI compares gains and losses, MACD compares moving averages, CCI measures normalized departure from an average, and Stochastic measures range location. ADX measures trend strength. Choose a question, define a rule, and compare results after costs.
Is ADX a directional momentum indicator?
ADX measures the strength of directional movement, not whether price is rising or falling. Use price structure or the relationship between +DI and −DI for direction. Falling ADX does not necessarily mean a reversal.
Should I combine RSI, MACD, and Stochastic?
You can test a combination, but these indicators share price information. Agreement may reduce trade count without improving net results. Compare each added condition with an unchanged baseline and avoid sizing positions merely by indicator agreement.
Are LuxAlgo momentum variants more accurate than standard indicators?
Adaptive MACD, Ultimate RSI, and Multi-Length Stochastic Average change the calculation or smoothing. Their different behavior is not a universal accuracy advantage. Compare their exact settings and trade timing with standard versions on the same data.
How can Quant help compare momentum strategies?
Quant can help code explicit indicator, entry, exit, and sizing rules. Inspect the generated code, run manually in the native strategy workflow, and verify individual trades, costs, and a later evaluation period.
Read next