Concept
CCI
CCI, also known as Commodity Channel Index, is a Momentum & Oscillators concept. The Library holds 1 implementation, a working definition you can pull into Quant.
The standard CCI indicator
CCI exactly as classically defined: the faithful reference build of the original formula, free to run in Quant.
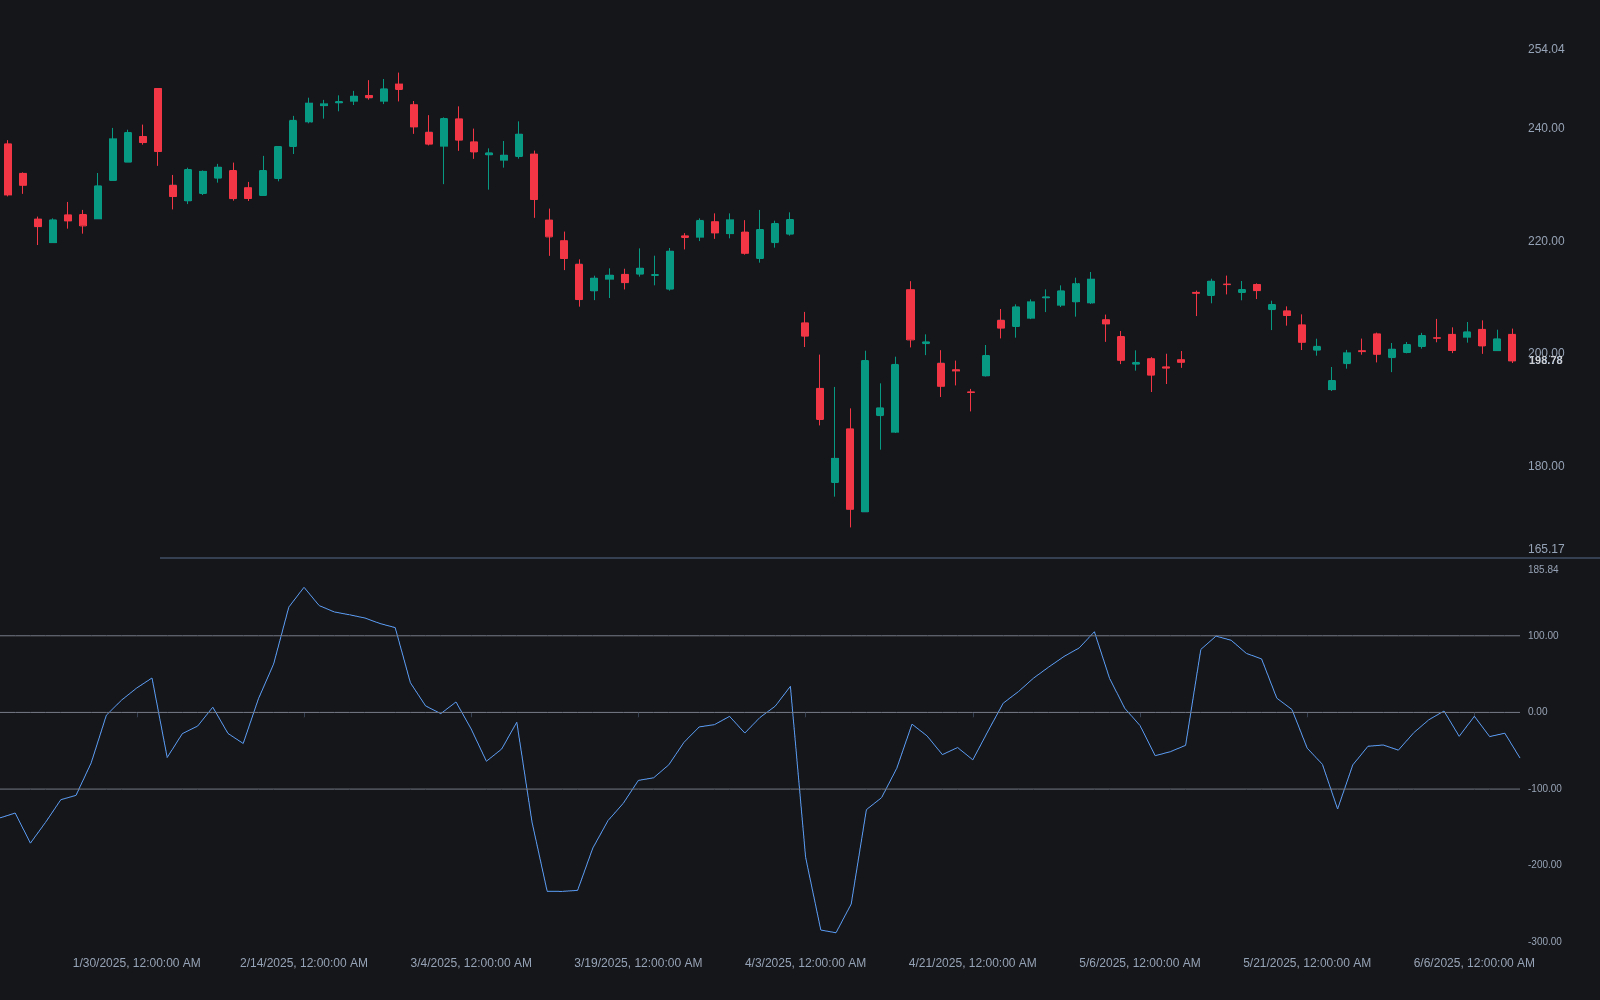
What is CCI?
CCI, the Commodity Channel Index, was introduced by Donald Lambert in 1980 to measure how far price has strayed from its own average. It starts from typical price, the average of high, low, and close. CCI equals typical price minus its n-period simple moving average, divided by 0.015 times the mean absolute deviation of typical price over the same window. The 0.015 constant is Lambert's scaling choice: it places roughly 70 to 80 percent of readings between -100 and +100, so those levels mark statistically unusual territory. Unlike RSI, CCI is unbounded, and strong trends can push it well beyond plus or minus 200.
Despite the name, nothing in the formula is commodity-specific; it runs on any series with highs, lows, and closes. What is genuinely contested is the reading. Lambert designed CCI as a trend tool: a cross above +100 signaled a strong move worth joining, and the drop back below +100 the exit. Later practice often inverts this, fading readings beyond +100 or -100 as overbought or oversold. Both readings describe the same line; which one pays depends on whether the market is trending or ranging, and the indicator itself does not tell you which regime you are in.
How to calculate CCI
The calculation runs on typical price and needs only a lookback length; 20 periods is a common default.
- 1Compute typical price for each bar: the average of the high, low, and close.
- 2Take the n-period simple moving average of typical price and subtract it from the current typical price to get the deviation.
- 3Compute the mean absolute deviation: the average of the absolute differences between each of the last n typical prices and that same moving average.
- 4Divide the deviation by 0.015 times the mean absolute deviation. Readings beyond +100 or -100 mark unusually stretched conditions, and the sign shows whether price sits above or below its average.
How it's calculated
Measures how far the typical price has strayed from its own average, scaled so most readings fall between -100 and +100.
MD is a mean absolute deviation about the current SMA, not a standard deviation.
Lambert chose 0.015 so roughly 70 to 80 percent of readings land inside -100 to +100.
Lambert's guidance was a length near one third of the dominant cycle; 20 is the usual platform default.
How traders use it
- As Lambert's original breakout rule: enter long when CCI crosses above +100 and exit when it falls back below, with the mirror image for shorts. Extremes are treated as strength, not exhaustion.
- As mean reversion inside a trading range: fade excursions beyond +100/-100 (or a stricter +200/-200) back toward zero, typically only when a separate filter says the market is not trending.
- As a zero-line bias filter: above zero means typical price is above its average, below zero the opposite, so the zero cross serves as a simple centerline regime read for other signals.
- As a divergence tool: price making a new extreme while CCI makes a lesser one is read as fading pressure, the standard regular divergence logic applied to an unbounded oscillator.
CCI vs neighboring oscillators
RSI: Both are momentum oscillators, but RSI is bounded 0 to 100 and measures the balance of gains versus losses, while CCI is unbounded and measures deviation from a moving average in scaled mean-absolute-deviation units.
Z-score: CCI is nearly a z-score of typical price, except it divides by mean absolute deviation rather than standard deviation and applies the 0.015 scale factor, which is why plus or minus 100 rather than plus or minus 2 marks the unusual zone.
Williams %R: Williams %R locates the close within the recent high-low range, a bounded position measure; CCI measures distance from the mean, so the two can disagree when the range itself drifts.
Concept family
Momentum & Oscillators
91 concepts mapped · 91 in the Library
CCI FAQ
Turn CCI into a trading strategy.
Take the implementation from this page into Quant, then build on it, backtest it on real data, and keep refining it in conversation.