Concept
Dark Cloud Cover
Dark Cloud Cover is a Chart & Candlestick Patterns concept. The Library holds 1 implementation, a working definition you can pull into Quant.
Top Dark Cloud Cover indicator
The top custom implementation, built on the original standard Dark Cloud Cover formula.
1 total
The Dark Cloud Cover implementation below can become a backtested trading strategy — describe your rules and Quant writes the code.
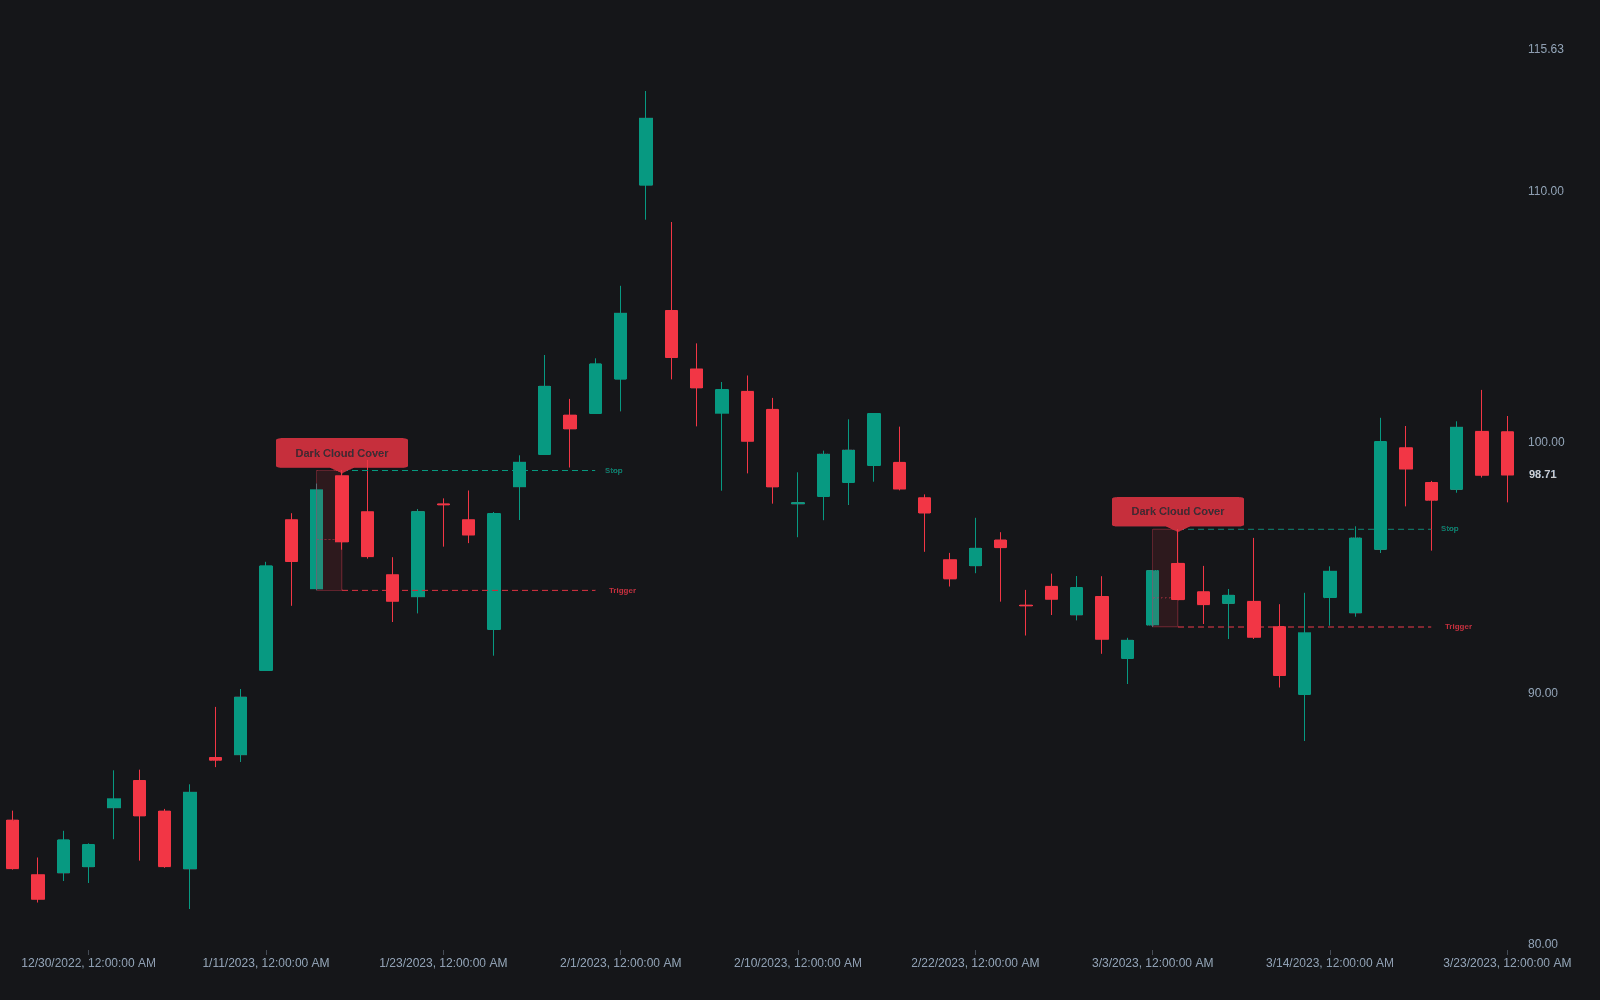
What is Dark Cloud Cover?
Dark cloud cover is a two-candle bearish reversal pattern from Japanese candlestick charting, introduced to Western readers by Steve Nison. After an advance, a strong bullish candle is followed by a candle that opens above the prior high and then sells off to close deep inside the prior real body, below its midpoint but above its open. The failed push into new ground and the deep close are the point: buyers were handed new highs and could not hold them.
The pattern reached the West through Nison's 1991 book Japanese Candlestick Charting Techniques, which catalogued the vocabulary Japanese traders had refined over generations; the Japanese name, kabuse, roughly means covering: the dark cloud spreading over the prior session's white candle. Within that vocabulary it sits among the two-candle reversals, conventionally ranked below the full engulfing pattern in strength because the second candle retraces only part of the first.
Definitions vary at the edges. The strict form requires the open above the prior candle's high; a relaxed form common in 24-hour markets, where true gaps are rare, accepts an open above the prior close. Depth matters too: a close below the midpoint is the standard threshold, and a close below the first candle's open entirely upgrades the pattern to a bearish engulfing. The piercing line is its bullish mirror. Next-candle confirmation is standard practice before acting.
The two candles compress a complete shift in control. The higher open proves demand was strong enough to pay up for new highs; the deep close proves supply absorbed all of it and more, leaving late buyers trapped above the market, and their exits are the fuel for follow-through. Traders grade instances accordingly: a longer first body to invade, a deeper close, and heavier volume on the second candle all imply more meaningful distribution. Like the rest of the candlestick pattern vocabulary, it is short-horizon evidence about two sessions rather than a trend forecast, which is why location and confirmation carry so much of the workload.
How to identify Dark Cloud Cover
The pattern needs a prior advance and two candles with a specific relationship. Checking the criteria in order keeps lookalikes out.
- 1Establish context: price should be in an uptrend or a clear multi-bar advance, with the first candle a strong bullish body, often a wide-range bar, extending that move.
- 2Check the second candle's open: strictly, above the first candle's high; the relaxed reading accepts an open above its close in markets that rarely gap.
- 3Check the second candle's close: below the midpoint of the first candle's real body but above its open. Deeper is stronger, and a close below the open makes it an engulfing instead.
- 4Weigh the supporting evidence: elevated volume on the second candle, or the pattern printing at prior structure rather than mid-range, upgrades the signal in most workflows.
- 5Wait for confirmation: a bearish follow-through candle or a break of the pattern's low before treating the reversal as active.
How traders use it
- As a fade trigger at a level: dark cloud cover printing into mapped resistance or after an extended run carries more weight than the same two candles mid-range.
- Entry and risk mechanics: common handling enters on downside follow-through or a break of the pattern's low, with the stop above the second candle's high (the failed new high).
- As one input in confluence: candlestick patterns are short-horizon evidence, so most workflows require trend context, a level, or volume agreement rather than trading every instance.
- As part of a scan family: screeners often group it with the engulfing bar and other two-bar reversals, then rank hits by trend context and depth of close so only the strongest instances get chart time.
- As a higher-timeframe trigger executed lower: a daily or weekly dark cloud cover defines the bearish scenario and its invalidation high, while intraday structure refines the entry to improve reward-to-risk on the same idea.
Dark Cloud Cover vs. related patterns
Bullish/bearish Engulfing: A bearish engulfing closes below the prior candle's open, wrapping the entire real body, while dark cloud cover stops partway down; the two share identical logic, with engulfing simply the deeper, stronger increment of the same selling.
Two-bar Reversal: The two-bar reversal is the generic frame, a strong bar answered by a strong opposite bar; dark cloud cover is the candlestick-specific case with named requirements for the open above the prior high and the close below the midpoint.
Pin Bar: A pin bar compresses the failed probe higher into a single candle's long upper wick; dark cloud cover spreads the same rejected-high story across two candles, and on a doubled timeframe one often collapses into the other.
Concept family
Chart & Candlestick Patterns
84 concepts mapped · 84 in the Library
Dark Cloud Cover FAQ
Turn Dark Cloud Cover into a trading strategy.
Take the implementation from this page into Quant, then build on it, backtest it on real data, and keep refining it in conversation.