VWAP Entry Strategies for Day Traders
VWAP entry strategies use a volume-weighted price benchmark to define crossing, pullback or rejection setups. A price above VWAP is not automatically a buy, and a price below it is not automatically a short. The useful question is whether a clearly defined setup produces acceptable results after costs, under the same anchor and execution assumptions you intend to use.
Start in native LuxAlgo charts: add VWAP Bands from Indicators → Orderflow, choose the anchor and price source, then inspect price behavior around the line. Quant, our coding agent, can help turn precise entry and exit rules into a strategy you inspect and run manually.
What VWAP Measures
VWAP is the sum of price multiplied by volume divided by the sum of volume over a specified window: VWAP = Σ(price × volume) / Σ(volume). A common candle-based source is HLC3, the average of high, low and close. The StockCharts calculation guide explains this bar-based approximation and the difference from using individual trades.
| Bar | Price source | Volume | Price × volume | Cumulative VWAP |
|---|---|---|---|---|
| 1 | 100 | 100 | 10,000 | 100.00 |
| 2 | 102 | 300 | 30,600 | 101.50 |
| 3 | 101 | 200 | 20,200 | 101.33 |
After three bars, 60,800 divided by 600 gives approximately 101.33. The simple average of the three price inputs is 101, demonstrating the effect of the heavier second-bar volume. Cumulative volume must be positive. Missing volume should be investigated rather than silently treated as valid data.
A candle approximation can change when the timeframe changes, because a bar’s selected price does not reproduce every transaction inside it. Volume may be venue-specific or a provider’s tick-volume measure. VWAP is not a company valuation, a map of outstanding positions or proof that institutions bought at a particular price.
Choose the Anchor Before Choosing an Entry
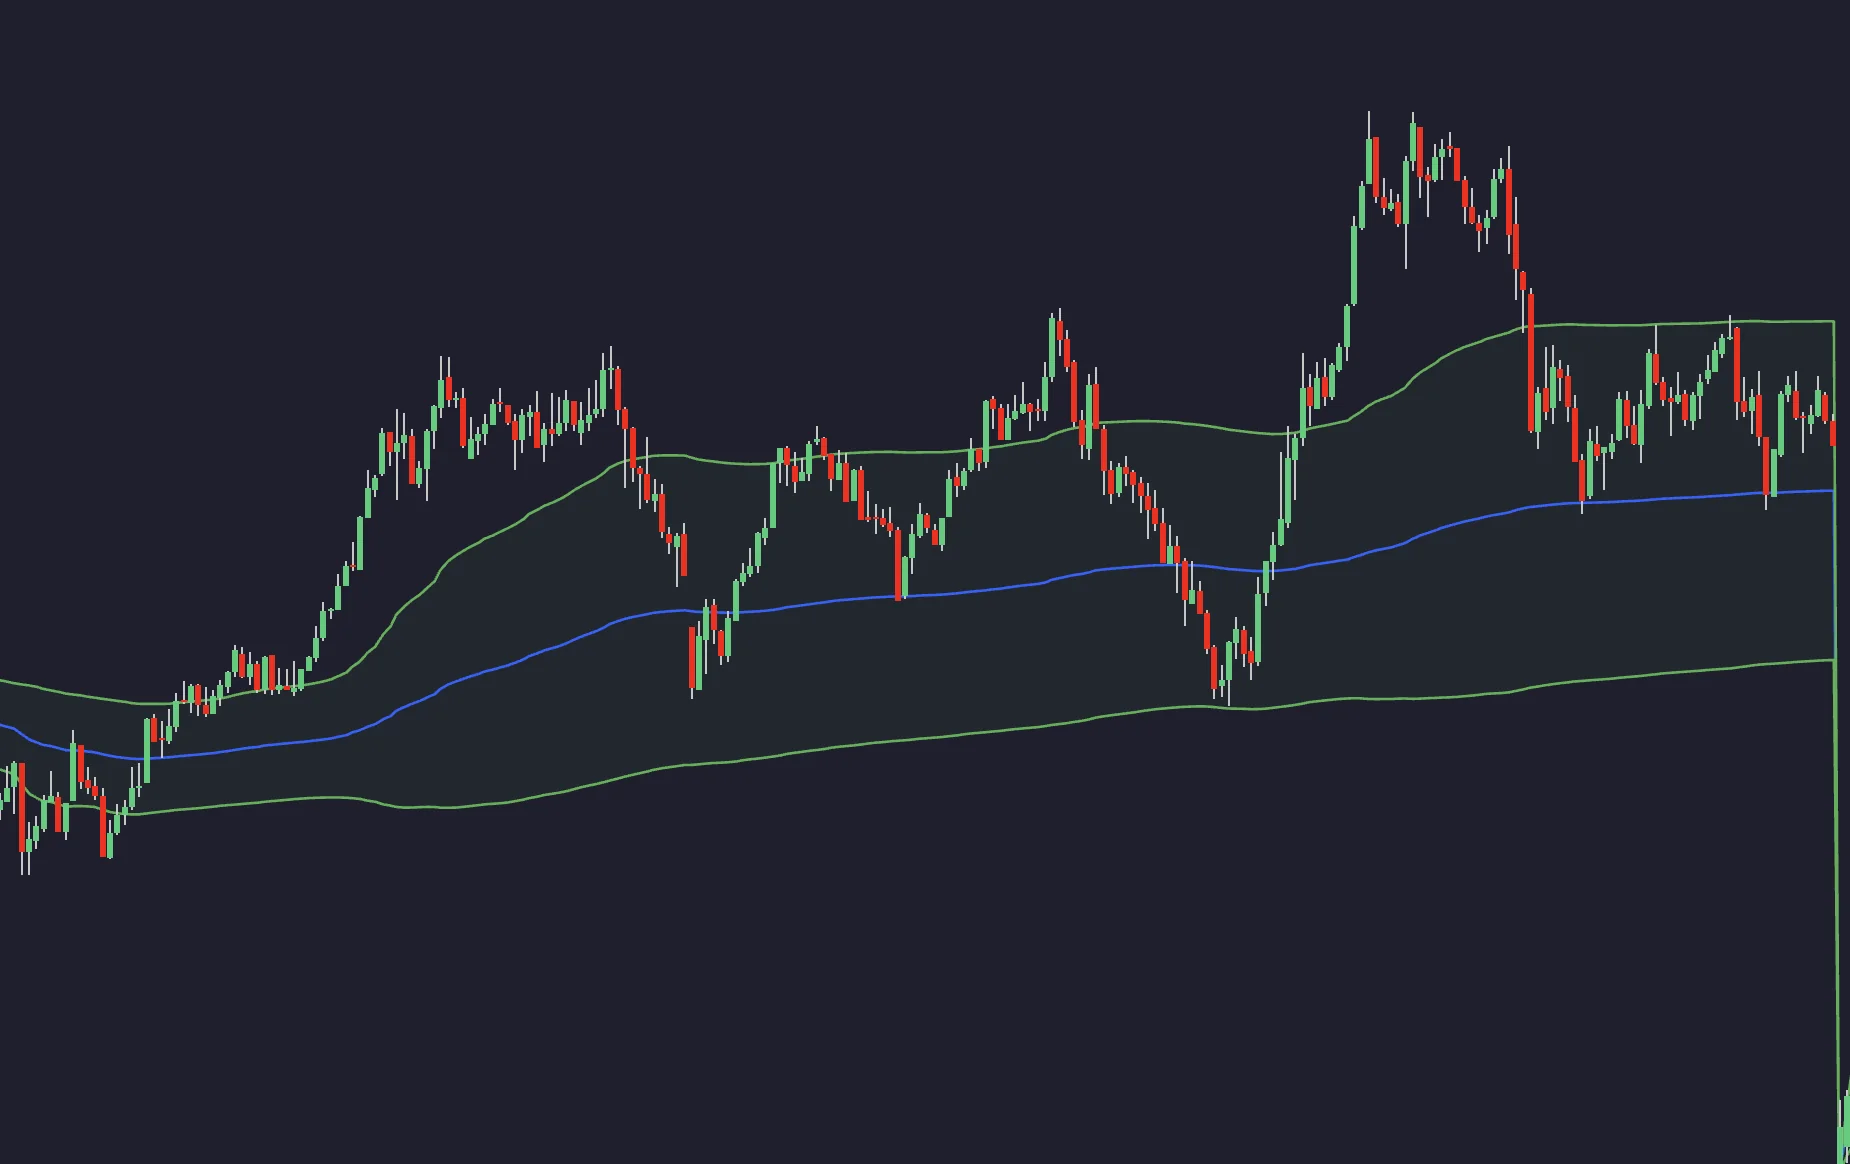
VWAP has meaning only relative to its calculation window. A regular exchange-session VWAP, a UTC-day VWAP and a VWAP anchored to a specific event can produce different values. Including or excluding extended-hours bars can also change the result. Match the symbol, feed, timeframe, session and anchor when comparing two charts.
LuxAlgo’s native VWAP documentation specifies UTC Day, Week or Month anchors, with Day as the default. The price source can be HLC3, OHLC4 or Close. A UTC-day reset should not be described as automatically resetting at a stock exchange’s opening bell.
At a reset, the calculation starts again with the new window’s data. That can create an apparent crossing caused partly by the benchmark restarting. If your rule requires a crossing, decide how to handle the first bar of a new window and compare completed bars within the same window. Early values use little data; later values retain more accumulated history.
Simple VWAP Entry Strategies
A Long Crossing Setup
One testable rule is a completed close moving from at or below VWAP to above it, with both observations in the same anchor window. Model an entry at the next available bar open rather than assuming you can always trade the closing signal price. A minimum volume or trend condition is optional and must be specified numerically.
Decide what invalidates the setup: a price-structure break, a fixed risk distance or a later completed close beneath VWAP. These create different strategies. Merely placing a stop “just below VWAP” does not define the distance, update frequency or protection against a gap.
A Short Crossing or Rejection Setup
The opposite crossing condition can be tested for shorts: a completed close moves from at or above VWAP to below it. A rejection setup instead waits for price to approach the line from below and close lower again. Define the permitted approach distance and the trigger candle rather than labeling every touch a rejection.
Short selling also depends on the instrument, account rules, borrow availability and costs. A brief move below VWAP during a broader advance may fail quickly. A bearish price condition can be useful for reviewing an existing long position without requiring a new short position.
Pullbacks and Dynamic Support or Resistance
| Price behavior | Setup to investigate | Important limitation |
|---|---|---|
| Price holds above a rising VWAP | Pullback toward VWAP followed by a specified bullish trigger | The line can fail as support |
| Price holds below a falling VWAP | Rebound toward VWAP followed by a specified bearish trigger | A reclaim can invalidate the idea |
| Price repeatedly crosses a flat VWAP | Stand aside or test a separately defined range strategy | Repeated crossovers can generate whipsaws and costs |
| Price is far from VWAP | Measure extension before considering a reversion rule | Strong trends can remain extended |
Treat support and resistance as observed behavior, not an obligation for price to bounce. A trend-following pullback rule and a mean-reversion rule have different assumptions. Switching between them after seeing the outcome makes a backtest difficult to interpret.
Combining VWAP With Momentum and Volume
RSI and MACD can add conditions, but both derive from price, while volume is already part of VWAP. Their agreement is not independent confirmation or a guaranteed accuracy improvement. Compare the base strategy with each added filter using the same sample and execution assumptions.
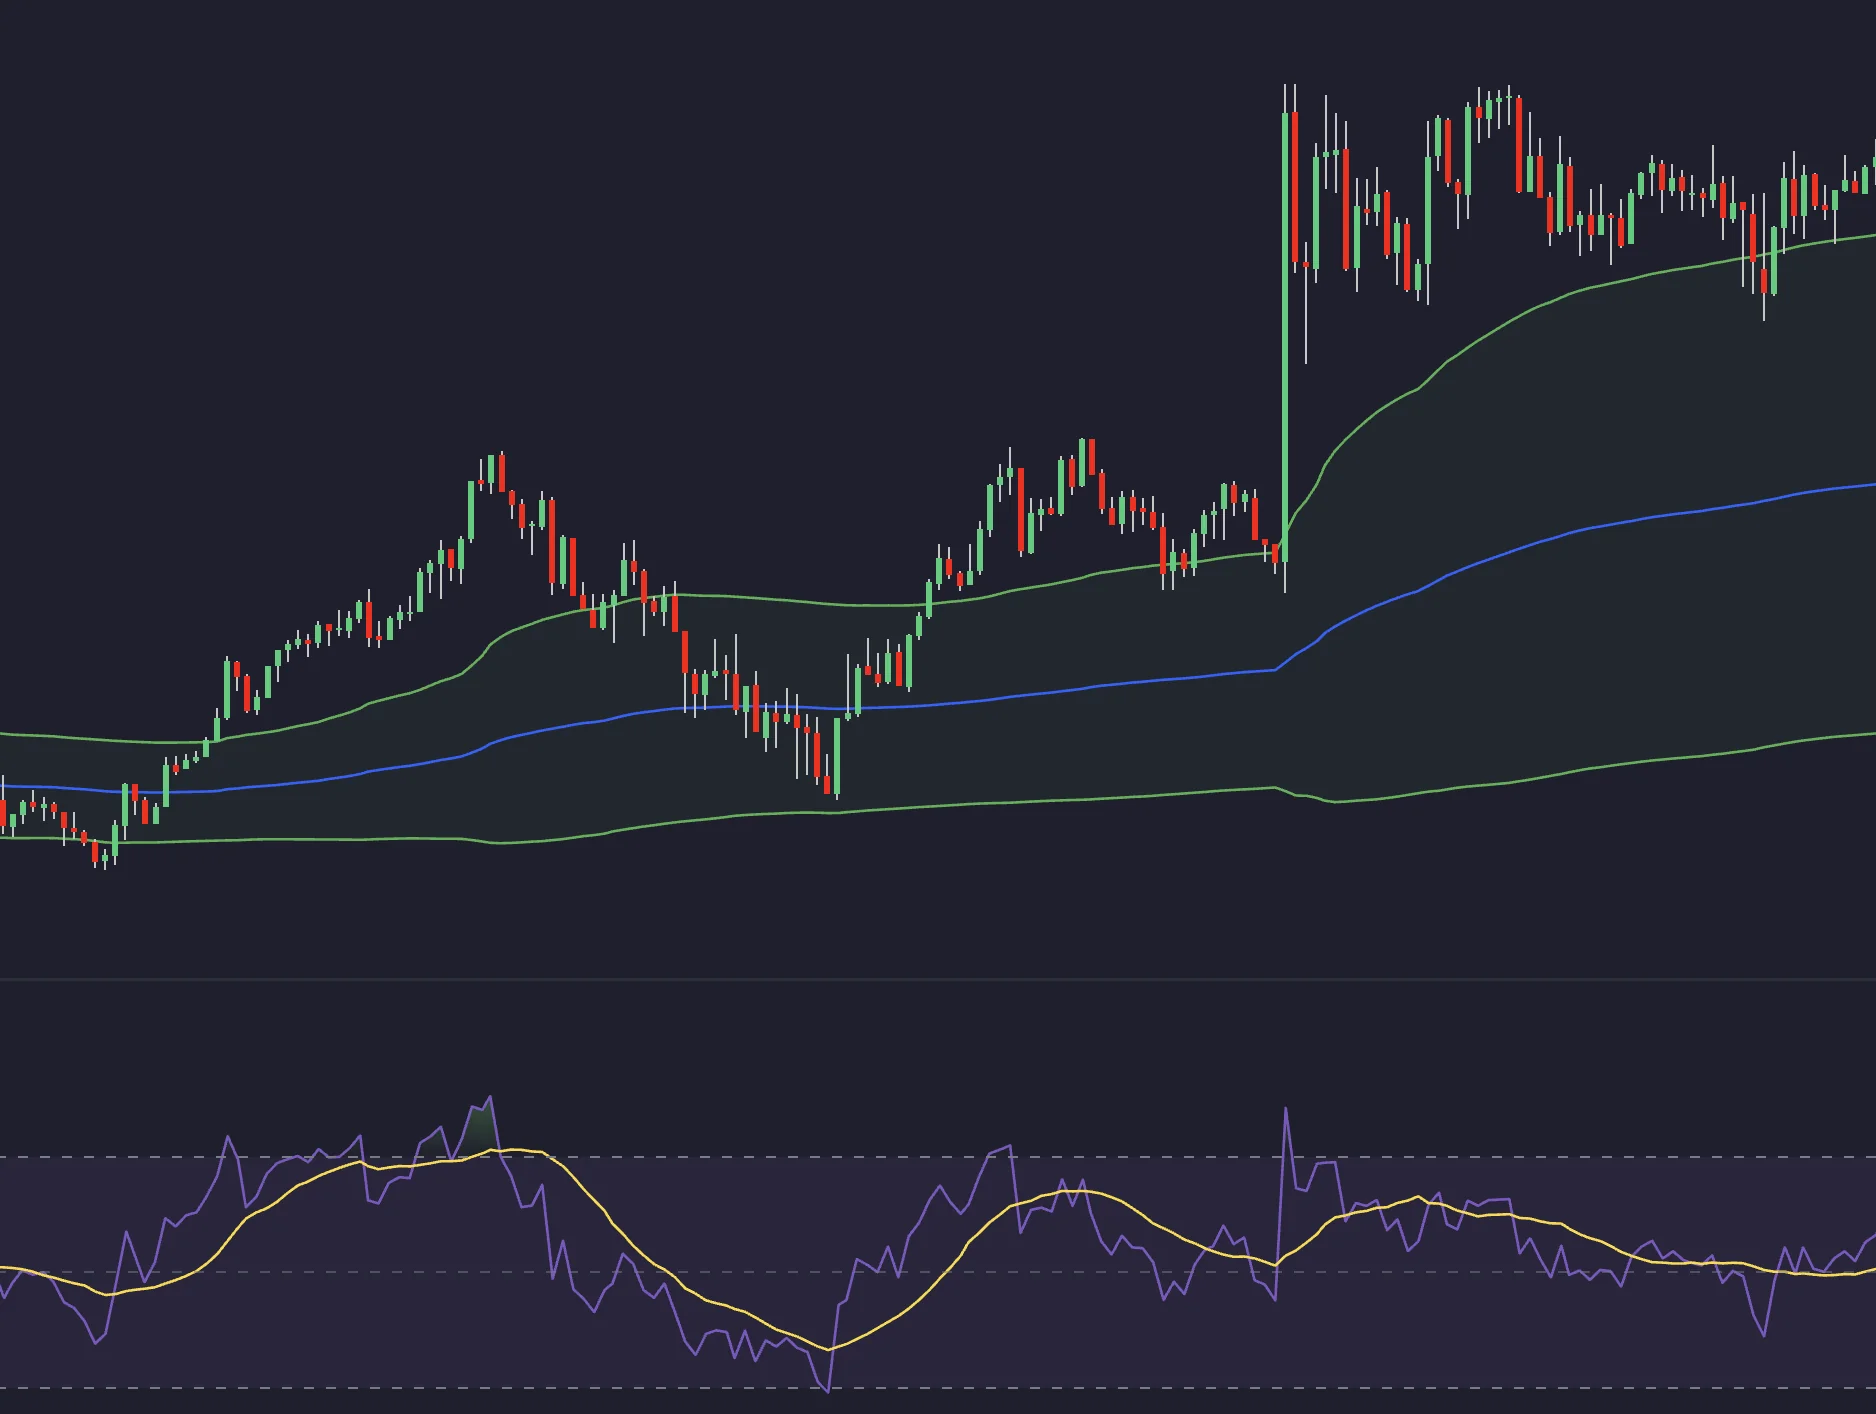
- RSI: “below 70” alone is not a bullish momentum rule; it also includes very weak readings. Define a specific range, crossing or direction if needed.
- MACD: specify whether the line is above its signal line, crosses it on this bar, or is above zero. Those conditions are different.
- Volume: define the comparison period and whether the current bar is excluded from the baseline. Compare similar times of day where intraday seasonality matters.
Higher activity can improve available liquidity in some circumstances, but the open and close can also bring rapid repricing, spreads and slippage. Test time-of-day segments instead of assuming the first two or final trading hours are universally more reliable. A stock session and a continuously traded crypto market need different timing rules.
VWAP Deviations and Bands
Percentage distance is 100 × (price / VWAP − 1). At price 103 and VWAP 100, the distance is +3%. That percentage is not the same as a standard-deviation multiple. There is no general rule that large-cap stocks reverse at 2%, mid-caps at 1.5% or liquid stocks at 1%.
Native VWAP Bands use volume-weighted standard deviation over the same anchored window, with up to three adjustable band pairs. Their width depends on the data accumulated in that window. A two-standard-deviation band is not a promise that 95% of future prices will remain inside it; intraday prices do not necessarily follow a stable normal distribution.
If testing reversion from an outer band, define the entry event, target, invalidation and maximum holding time. For example, returning inside a band after a close outside is different from entering immediately at the first touch. A trend filter must use information available then, not a hindsight label that the entire day was a range.
A Worked Short-Trade Example
Suppose the selected VWAP is 27.10 when a completed bearish signal appears. Assume the next available short fill is 27.05, with a fixed initial stop at 27.30. The modeled price risk is 0.25 per share, measured from the fill to the stop—not 0.20 just because that is the distance above the earlier VWAP value.
| Item | Calculation or rule | Result |
|---|---|---|
| Risk budget after estimated costs | 100 budget − 10 total costs | 90 available for price risk |
| Position size | 90 / 0.25 | 360 shares |
| Modeled stop loss | 360 × 0.25 + 10 | 100 |
| Adverse exit at 27.50 | 360 × (27.50 − 27.05) + 10 | 172 |
| Optional signal exit | Completed close back above the current VWAP; model next available fill | Separate from the protective stop |
These are hypothetical values, not a recommended position. A stop can execute worse than its trigger price. Borrowing charges must be included if relevant and not already in the cost estimate. Define a session exit cutoff for a day-trading rule, and specify which exit takes priority if several conditions occur.
A fixed initial stop and a changing VWAP exit are different mechanisms. If using a trailing stop based on VWAP, define when it updates and whether it may loosen. Do not assume a 0.20–0.30 distance suits every instrument, price, volatility level or tick size.
Build and Test the System in Native LuxAlgo Charts
Select the active chart, add VWAP Bands from Indicators → Orderflow and set the intended UTC anchor and source. Add Basic RSI or MACD if your test needs them. Save the configuration in an indicator template so the comparison is repeatable; the indicator guide explains settings and templates.
Describe the exact setup to Quant, our coding agent, including the anchor, completed-bar crossing, reset handling, entry timing, position size, stops, other exits and costs. Inspect the generated code and run manually. Making strategies with Quant covers generation and review; the strategy viewer supports examining the resulting backtest and trades.
- Use ordinary candles and the intended venue and timeframe. Confirm that the strategy’s VWAP matches the plotted calculation.
- Inspect trades around resets, gaps and exit conflicts. A valid script is not proof that it implements the intended trading assumptions.
- Include commission, slippage and relevant financing or borrowing costs. Review net results, drawdown and trade count.
- Compare crossing, pullback and range ideas separately. Change a small declared set of parameters, then evaluate a later period not used to choose them.
- Record the settings and findings. Community ideas can suggest hypotheses, but independently test them on your data before adopting them.
Periodic Linear Regressions: A Different View
The Periodic Linear Regressions study provides a complementary price-fit perspective. It fits a regression over the chosen anchor period and can show extremities based on root mean squared error. This is not a substitute calculation for volume-weighted average price, and its channel bands are not VWAP deviation bands.
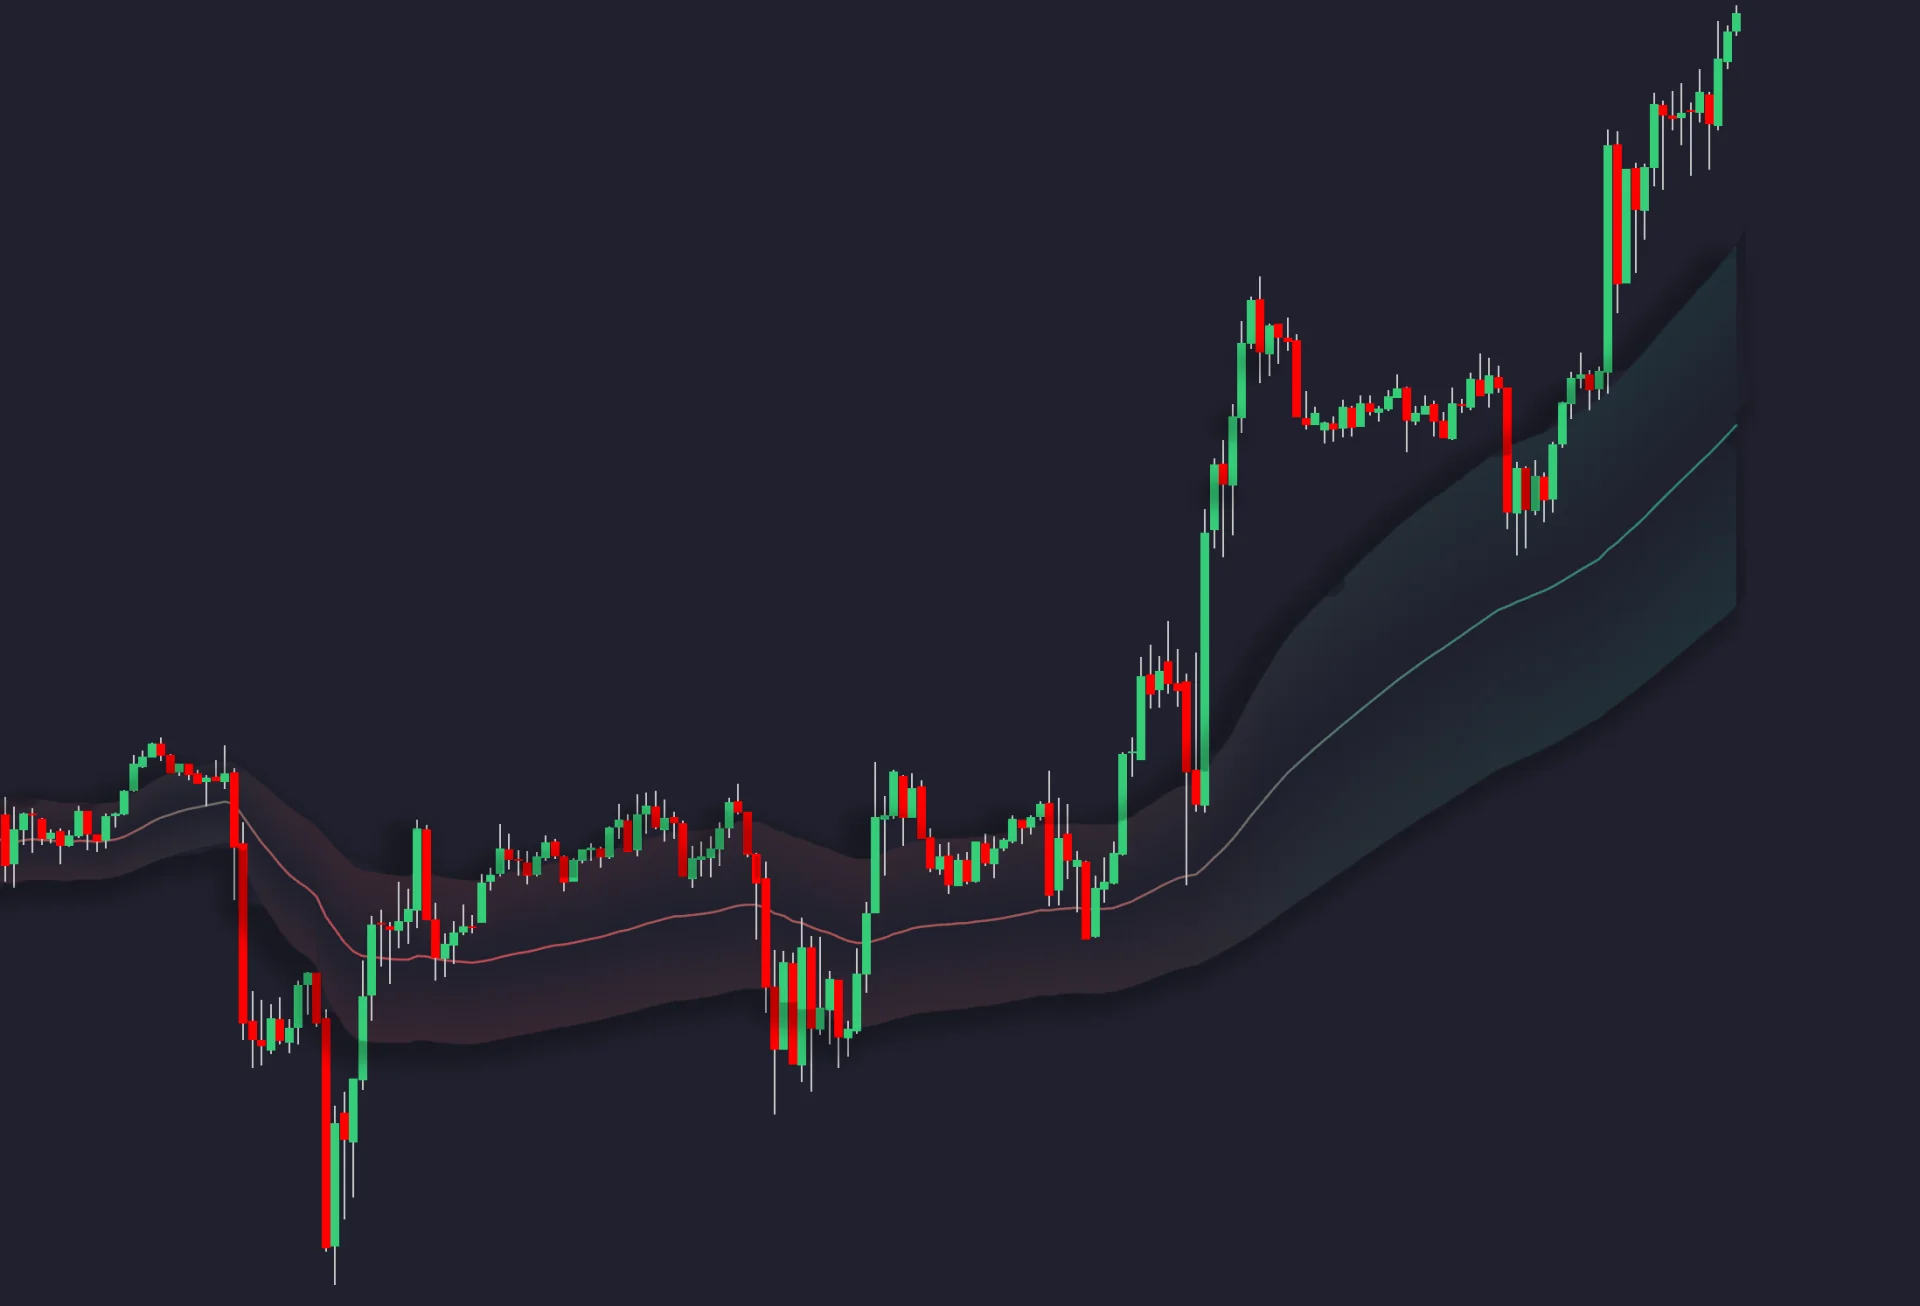
The study’s Static method redraws the period’s straight fit as data arrives and may repaint until the period ends. Rolling plots successive fitted endpoints. Do not backtest entries against a finalized static line as though the entire line existed earlier. Anchor Type, Anchor Period, Source and the extremity multiplier should be recorded when comparing results.
Choose the tool that answers the question you are testing. VWAP summarizes volume-weighted prices since an anchor; regression describes a fitted relationship through price observations. Neither guarantees support, resistance or a reversal.
FAQs
What is an example of a VWAP entry?
One testable long rule requires a completed close to cross above VWAP within the same anchor window, followed by a modeled entry at the next available open. Define the exit, position size, costs and reset handling before evaluating it.
Does LuxAlgo VWAP reset at the stock market open?
The documented native VWAP Bands use UTC Day, Week or Month anchors. A UTC-day window may differ from an exchange’s regular trading session, so check the intended window and data coverage.
Is a move above VWAP automatically bullish?
It means price is above the chosen volume-weighted benchmark. Whether that is a useful long signal depends on the complete rule, market context and execution costs.
Do two-standard-deviation bands guarantee a reversal?
No. They describe dispersion in the anchored historical data, not a guaranteed boundary or future probability. Price can remain extended during a strong trend.
How far from VWAP should a stop be?
There is no universal cent or percentage distance. Define the setup’s invalidation, account for volatility and execution, then size from the assumed entry to the stop. Specify whether the stop is fixed or updates over time.
Can Quant test a VWAP strategy?
Yes. Describe precise anchor, entry, exit and risk rules, inspect the generated code and run manually. Verify that the strategy calculation matches your chart and review costs, individual trades and later-period performance.
Read next